
Mobile app · Tools
Trend Score and AI analysis in Stock Master
How Stock Master’s 0–100 Trend Score is calculated from slope, smoothness, relative strength and risk, and how to use AI analysis, Market Briefing and follow-ups.
On this page
Two features in Stock Master summarize a stock for you, in very different ways. The Trend Score is a number from 0 to 100, calculated by a fixed formula from the price history, that rates how steadily and strongly a stock has been rising. AI analysis is written text: a language model reads the stock's data and writes a short report you can question further. One is a measurement; the other is an opinion. Both are useful if you know which is which.
This guide explains how the Trend Score is built, how to read it, and what the AI features do, where they live and what they cost.
The Trendscore tab
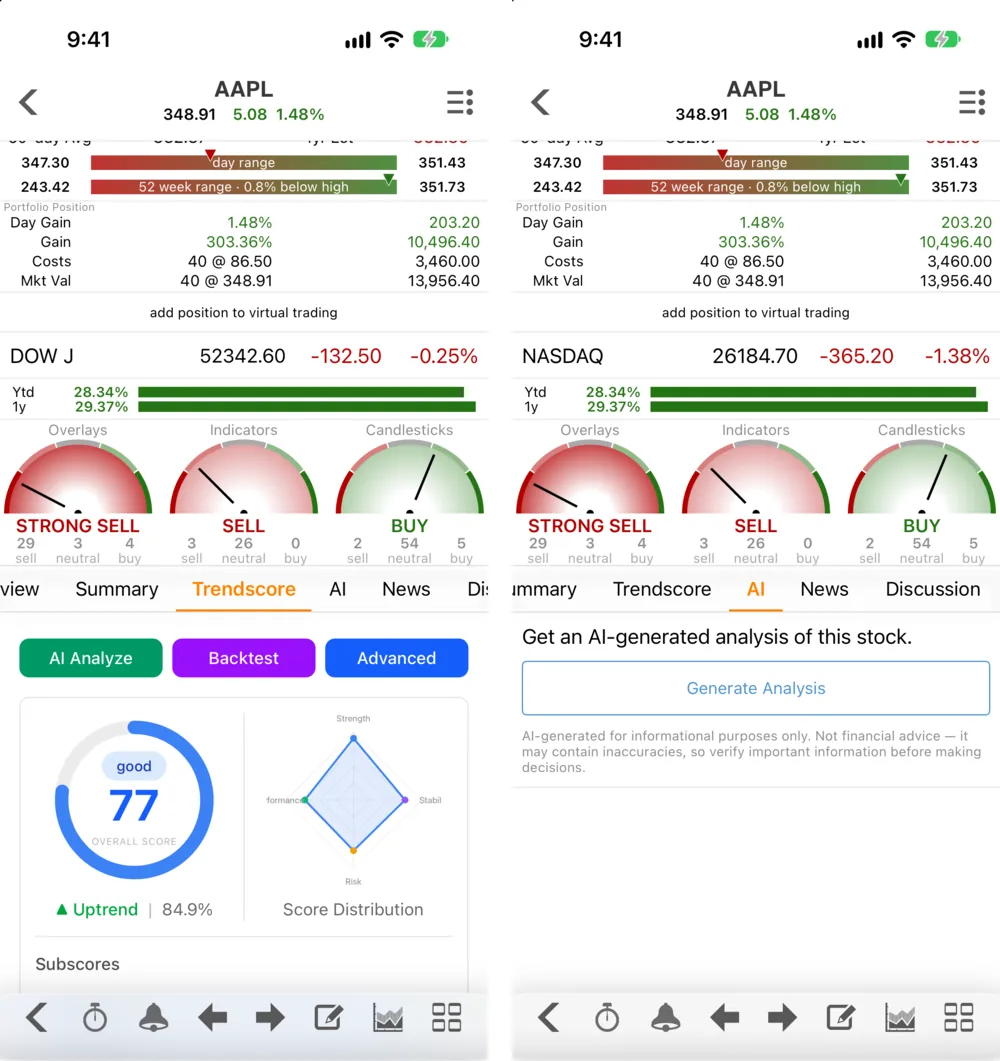
Open any quote and swipe the tabs to Trendscore. You see:
- The overall score in a ring with its rating — 77, good, for Apple on October 30, 2026 — and the trend direction (Uptrend, with a percentage).
- A Score Distribution radar across four subscores.
- AI Analyze, Backtest and Advanced buttons. Advanced changes the settings behind the score, such as the lookback window and optional components.
- Subscores with bars, and an expandable Trend Score - Guide that explains the method.
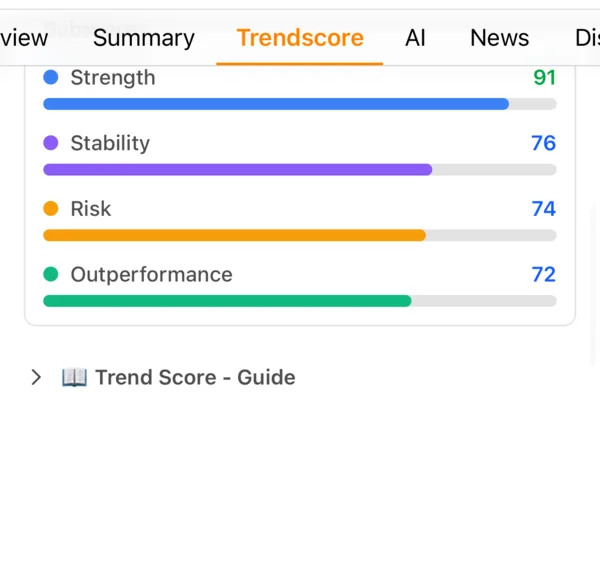
The four subscores — Strength, Stability, Risk and Outperformance — summarize the components below: how fast the trend rises, how smoothly, how much volatility and drawdown came with it, and how it compared with the benchmark.
The Trend Score favorite action on Home opens a market-wide view for discovering high-scoring stocks.
How the Trend Score is calculated
Each component is scored from 0 to 100, then blended with these weights:
| Component | Weight | What it measures |
|---|---|---|
| Trend Slope | 30% | The annualized return implied by a straight-line fit through the log of the price. About 25% a year scores near 100; a negative slope scores poorly. |
| Smoothness (R²) | 20% | How closely the price follows that straight line. R² of 1.00 (shown as 100) is a perfectly straight climb; 0.30 is erratic. |
| Relative Strength | 15% | How much the stock beat a benchmark such as the S&P 500 over the same period. |
| Trend Alignment | 15% | The share of days the price closed above its 50-day EMA, with 5 bonus points when the 20-day EMA is above the 50-day, which is above the 200-day. |
| Volatility | 10% | Lower annualized volatility scores higher: about 15% scores near 100, 60% or more near 0. |
| Max Drawdown | 10% | The worst peak-to-trough fall: under 5% scores 100, over 40% near 0. |
| Momentum | 0% | The return over the second half of the window. Off by default; can be switched on under Advanced. |
The weights add to 100%. The guide also reports bonus metrics that are shown but not scored: the Sortino, Calmar and information ratios, beta and alpha, and a trend confidence figure.
Reading the score
| Score | Rating | Meaning |
|---|---|---|
| 80–100 | Excellent | Ideal steady uptrend |
| 65–79 | Good | Strong with minor imperfections |
| 50–64 | Moderate | Trending but noisy or slow |
| 35–49 | Weak | Questionable trend |
| 0–34 | Poor | No meaningful uptrend |
Because the score rewards smooth gains, a stock that doubled in three violent jumps can score lower than one that rose 30% in a straight line. That is deliberate: it is a measure of trend quality, the thing trend followers want, not of total return. Its limits follow from the same design. It looks only backwards, it says nothing about valuation, and a stock with a long smooth rise can reverse sharply. The ideas behind the components are covered in Exponential moving average (EMA): formula and how to use it and Beta: market beta explained, and what Finabase’s BETA study shows.
AI analysis
The AI tab on a quote offers Generate Analysis — "an AI-generated analysis of this stock": a short written report, and Ask a follow-up lets you ask questions about it ("what drove the last quarter?"). Every report carries the reminder that it is AI-generated, for information only, may contain mistakes, and isn't financial advice.
AI appears in other places too:
- AI Analysis in a watchlist's ≡ Actions menu reviews the whole list.
- AI Portfolio Analysis on a portfolio's AI tab.
- Market Briefing (side menu › Stock Screen) — a written summary of the day's market.
- Earnings Preview in a quote's Actions menu, before a company reports.
- Improve with AI when writing notes.
- AI Analyze on the Trendscore tab.
Limits. AI features need you to be signed in. Free accounts get one free stock analysis a day across all symbols, and can watch an ad for each extra one. Plans raise the daily chat limit: 100 requests a day with Essentials, 500 with Plus and 1,000 with Premium (Stock Master plans: Essentials, Plus and Premium compared).
Treat AI text like a well-read colleague's first draft: a quick orientation, worth checking. Numbers in the report should match the quote screen and the company's filings; if they don't, trust the filings.
Frequently asked questions
What is a good Trend Score?
65 or higher is Good and 80 or higher Excellent — a steady, low-drawdown uptrend. It describes the past trend only, not future returns.
Why does a stock that went up a lot have a mediocre Trend Score?
The score rewards smoothness and controlled risk as well as slope. Big gains with deep drawdowns and high volatility lose points on Smoothness, Volatility and Max Drawdown.
Is the AI analysis free?
Signed-in free accounts get one stock analysis per day, plus extra ones by watching an ad. Plans include up to 100, 500 or 1,000 AI requests a day.
Is the AI analysis investment advice?
No. It is an automated summary for information only and can contain mistakes. Check important facts against the company's filings.
Summary
The Trend Score turns a price history into a 0–100 grade for trend quality, from slope, smoothness, relative strength, alignment, volatility and drawdown. AI analysis turns the stock's data into readable text you can question further. Use the score to rank and the text to orient yourself, and remember both look backwards.