
Web app · Charts
Backtest indicator signals and rule-based strategies on Finabase
Backtest indicators and candlestick patterns on a stock with Finabase on the web, read trades, win rate and gain, and build if/then allocation strategies over two years.
On this page
Before trusting a signal with money, it is worth asking how it would have done. Finabase has two tools for that. Backtest takes one stock and a set of indicators or candlestick patterns, and trades every signal they produced over a range you choose. Strategy lets you write allocation rules — "if SPY is above its 50-day average, hold SPY, otherwise hold something else" — and replays them over two years of real prices. Both are the same backtests and strategies you keep in the Stock Master app.
This guide covers both tools, how to read their results, and the traps every backtest falls into.
Backtesting signals on a stock
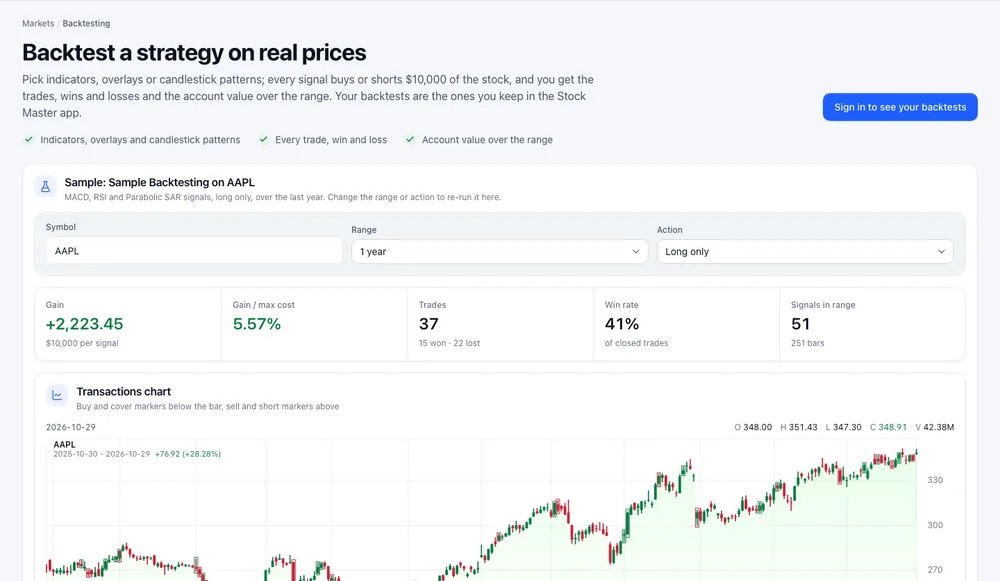
Open Research › Backtest. Signed out you get a working sample, Sample Backtesting on AAPL, which combines MACD, RSI and Parabolic SAR signals, long only, over one year. You can change its Range and Action to re-run it.
Signed in, Your backtests lists your own; every account starts with three — Sample Backtesting, Candlestick Patterns and Doji Star Pattern, all on AAPL. New backtest takes a name and Create.
Settings
- Symbol — any stock, ETF or coin.
- Range — from one day to the full history.
- Action — Long & short (buy on bullish signals, short on bearish), Long only or Short only.
- Strategy panel — the studies whose signals are traded. Switch each on or off, Edit parameters, Remove, or add any indicator or candlestick pattern from the chart library.
Change a setting and the page previews the result ("Previewing unsaved settings") before you Save.
Reading the result
- Gain — total profit or loss in dollars, with $10,000 per signal.
- Gain / max cost — the gain as a percentage of the most capital tied up at any one time.
- Trades — closed trades, with how many won and lost; Win rate — the share that won.
- Signals in range — how many signals fired, out of how many bars.
- Results split by Long, Short and Total, a Market value / cost chart, a Transactions chart (buy and cover markers below the bars, sell and short markers above) and the full transactions table.
In the sample above, 51 signals over 251 bars produced 37 closed trades, 15 winners and 22 losers, for a gain of $2,223.45 — 5.57% of the maximum capital used. A 41% win rate can still make money when the winners are larger than the losers.
Rule-based strategies
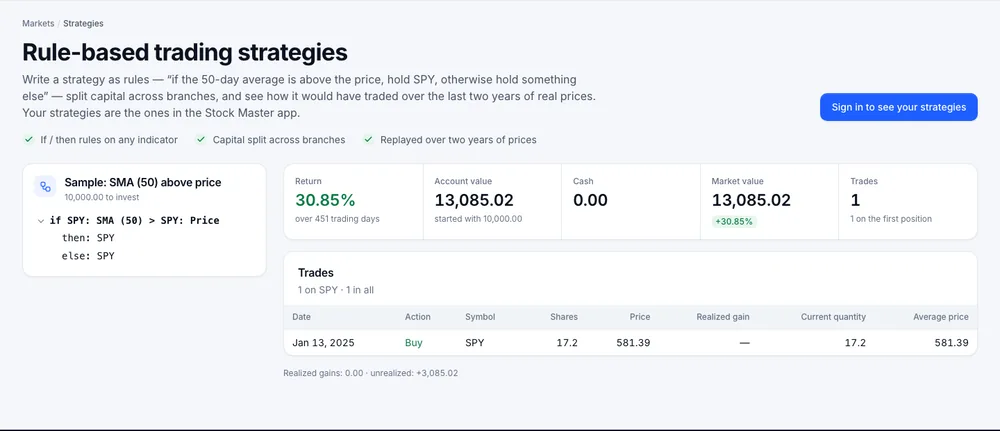
Research › Strategy is for allocation rules rather than single-stock signals. A strategy is a tree:
- A condition compares two things — an indicator or a constant on each side — with is above (>), **is below (<)** or **equals (=)**: "SPY: SMA (50) > SPY: Price".
- Then and else branches say what to hold: a symbol to buy, or further conditions.
- Weights split capital across sibling branches; they rebalance to 100%.
Edit the rules in the Diagram or Tree view (click a box to edit it), set the Amount to invest, and the preview replays the strategy over two years: Return, Account value, Cash, Market value and the Trades it made. New strategies start from the SMA (50) rule on SPY.
The traps of backtesting
- Overfitting. Tuning parameters until the past looks great usually fits noise. Test the same settings on other symbols and ranges.
- One stock, one period. A rule that worked on AAPL in a rising year may fail in a falling one. Try a range that includes a bear market.
- No costs. Results ignore commissions, spreads and slippage, and shorting costs; frequent trading looks better here than in reality (Liquidity and slippage: volume, depth, spread and market impact).
- Hindsight. Signals are calculated on completed bars; you could not always have traded at that bar's price.
The library's Backtesting basics: biases, costs and an honest SPY test covers these in depth.
Frequently asked questions
Is backtesting free?
Yes. The samples run signed out; saving your own backtests and strategies needs a free account, and they count toward your plan's list limit.
Can I backtest a candlestick pattern?
Yes. Add any of the 61 candlestick patterns to a backtest's Strategy panel.
Why is the gain different from buy and hold?
The backtest is only in the market between signals. Compare it with the symbol's return over the same range on the chart.
Can I trade a strategy automatically?
No. Strategies and backtests are research tools. To practise, use paper trading (Practise with Finabase paper trading on the web).
Summary
Use Backtest to see how a stock's indicator and pattern signals would have traded, and Strategy to replay if/then allocation rules over two years. Read the win rate together with the size of wins and losses, and test the same idea on other symbols and periods before believing it. On iPhone, see Backtest a trading strategy in Stock Master.