

ExxonMobil Holdings Corporation XOM
Regular-session close
After hours · Nov 20, 7:56 PM ET
- YTD
- +32.95%
- 1 year
- +36.72%
5D -7.63 (-4.55%)
- Market cap
- 652.63B
- Revenue (ttm)
- 388.23B
- Profit margin
- 10.46%
- EPS (ttm)
- 9.72
- Shares out
- 4.08B
- P/E ratio
- 16.46
- Forward P/E
- 12.81
- Dividend
- 4.28 (2.69%)
- Ex-dividend date
- Nov 16, 2026
- YTD return
- +32.95%
- 1-year return
- +36.72%
- Volume
- 18.68M
- Avg volume
- 13.62M
- Open
- 158.83
- Previous close
- 158.93
- Day's range
- 158.60 – 161.53
- 52-week range
- 114.51 – 187.25
- Beta
- 0.14
- Analysts
- Buy
- Price target
- 184.18 (+15.1%)
- Earnings date
- Jan 29, 2027
- 50-day average
- 169.46
Key statistics
- 200-day average
- 156.77
- Enterprise value
- 677.14B
- PEG ratio
- 1.26
- Price / sales
- 1.68
- Price / book
- 2.46
- Payout ratio
- 42.39%
- Revenue growth
- 32.60%
- Free cash flow
- 28.32B
- Total cash
- 12.15B
- Total debt
- 34.25B
- Return on equity
- 15.53%
- Short % of float
- 1.25%
Fundamental scorecard
21 of 25 checks passed on XOM’s reported financials
21of 25 checks passed
- Value 2 of 5
- Growth 5 of 5
- Profitability 5 of 5
- Financial health 4 of 5
- Dividend 5 of 5
Statements to Sep 30, 2026.
Analyst view
Consensus: buy
- Target (low)
- 160.00
- Target (mean)
- 184.18
- Target (high)
- 213.00
- Strong buy3
- Buy6
- Hold17
- Sell0
- Strong sell0
Next earnings
Jan 29, 2027
Expected Jan 29, 2027. Consensus EPS estimate 4.11.
Financials — quick view
Earnings
| Report date | Quarter ending | EPS estimate | EPS reported | Surprise | Surprise % |
|---|---|---|---|---|---|
| Jan 29, 2027 | Dec 30, 2026 | 4.27 | — | — | — |
| Oct 30, 2026 | Sep 30, 2026 | 4.12 | 4.23 | +0.11 | +2.67% |
| Jul 31, 2026 | Jun 30, 2026 | 3.56 | 3.52 | -0.04 | -1.12% |
| May 1, 2026 | Mar 31, 2026 | 0.984 | 1.16 | +0.18 | +17.89% |
| Jan 30, 2026 | Dec 31, 2025 | 1.70 | 1.71 | +0.01 | +0.59% |
| Oct 31, 2025 | Sep 30, 2025 | 1.82 | 1.88 | +0.06 | +3.30% |
Upgrades / downgrades
| Date | Firm | Action | From | To |
|---|---|---|---|---|
| Nov 13, 2026 | Barclays | main | Overweight | Overweight |
| Nov 12, 2026 | Bernstein | main | Outperform | Outperform |
| Nov 6, 2026 | Freedom Broker | main | Hold | Hold |
| Nov 4, 2026 | Citigroup | main | Neutral | Neutral |
| Nov 4, 2026 | TD Cowen | main | Buy | Buy |
| Nov 2, 2026 | UBS | main | Buy | Buy |
About ExxonMobil Holdings Corporation
ExxonMobil Holdings Corporation engages in the exploration and production of crude oil and natural gas in the United States, Canada, and internationally. The company operates through Upstream, Energy Products, Chemical Products, and Specialty Products segments. Its Upstream segment explores for and produces crude oil and natural gas. The Energy Products segment offers fuels, aromatics, and catalysts, as well as licensing services. Its Chemical Products segment manufactures and sells olefins, polyolefins, and intermediates. The Specialty Products segment offers finished lubricants, basestocks, waxes, synthetics, elastomers, and resins. It is also involved in the manufacture, trade, transport, and sale of crude oil, natural gas, petroleum products, petrochemicals, and other specialty products; and pursuit of lower-emission and business opportunities, including carbon capture and storage, hydrogen, lower-emission fuels, Proxxima resin systems, carbon materials, low-carbon data center, and lithium. In addition, the company offers aviation fuel. It sells its products under the Exxon, Esso, and Mobil brands. The company was formerly known as Exxon Mobil Corporation and changed its name to ExxonMobil Holdings Corporation in July 2026. ExxonMobil Holdings Corporation was founded in 1870 and is headquartered in Spring, Texas.
- Sector
- Energy
- Industry
- Oil & Gas Integrated
- Country
- United States
- Website
- corporate.exxonmobil.com
News
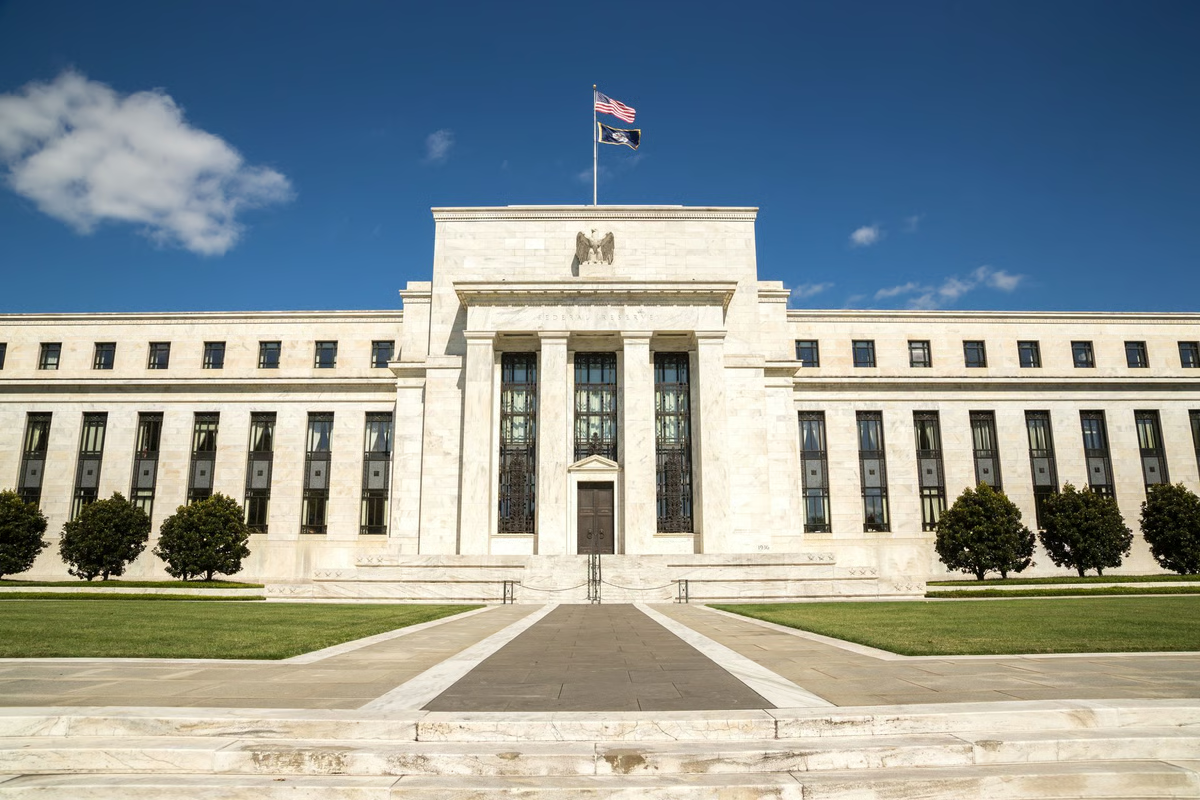 If the Fed Hikes Rates This Year, I'm Loading Up on This 1 ETF
 Gas Prices Are Dropping at a 2008 Pace Right Before Thanksgiving
 ExxonMobil Corporation $XOM Position Cut by Barrow Hanley Mewhinney & Strauss LLC
 RSP & EQL: Equally Weighted, But Not Equals
 ExxonMobil Secures Government Approval for Revised Rovuma LNG Plan
 TechnipFMC Deepens ExxonMobil Ties With Guyana Longtail Awards
 How Retirees Can Turn $750,000 Into Passive Income With These 5 Dividend Stocks
 Angola's ANPG says Exxon takes $4 billion FID on Kizomba fields, makes discovery
 Here’s How Much You Would Have Made Owning ExxonMobil Holdings Stock In The Last 5 Years
 How Retirees Can Turn $1 Million Into Passive Income With These 5 Dividend Stocks
Your note
Sign in to keep a note on XOM — it syncs with the Stock Master app.
Insider holders
| Insider | Relation | Latest transaction | Date | Shares held |
|---|---|---|---|---|
| AMMANN DANIEL | Officer | Stock Award(Grant) | Nov 24, 2025 | 475,841 |
| CHAPMAN NEIL A | Officer | Stock Gift | Dec 17, 2025 | 1,053,560 |
| FOX LEONARD M. | Officer | Stock Award(Grant) | Nov 24, 2025 | 328,691 |
| GIBBS JON M. | Officer | Stock Award(Grant) | Nov 24, 2025 | 402,847 |
| MALLON LIAM M. | Officer | Stock Award(Grant) | Nov 25, 2024 | 663,352 |
| MCKEE KAREN LYNETTE | Officer | Stock Award(Grant) | Nov 25, 2024 | 0 |
Institution ownership
| Holder | % held | Shares | Value | Reported |
|---|---|---|---|---|
| Blackrock Inc. | 8.12% | 331,225,100 | 52.99B | Sep 29, 2026 |
| Vanguard Capital Management LLC | 6.62% | 270,232,980 | 43.24B | Sep 29, 2026 |
| State Street Corporation | 5.21% | 212,719,297 | 34.03B | Sep 29, 2026 |
| FMR, LLC | 3.58% | 145,933,748 | 23.35B | Sep 29, 2026 |
| Vanguard Portfolio Management LLC | 2.88% | 117,569,337 | 18.81B | Sep 29, 2026 |
| Geode Capital Management, LLC | 2.45% | 99,964,365 | 15.99B | Sep 29, 2026 |
Fund ownership
| Holder | % held | Shares | Value | Reported |
|---|---|---|---|---|
| VANGUARD INDEX FUNDS-Vanguard Total Stock Market Index Fund | 3.23% | 131,586,172 | 21.05B | Jun 29, 2026 |
| VANGUARD INDEX FUNDS-Vanguard 500 Index Fund | 2.63% | 107,399,224 | 17.18B | Jun 29, 2026 |
| SELECT SECTOR SPDR TRUST-State Street Energy Select Sector SPDR ETF | 1.41% | 57,650,574 | 9.22B | Sep 29, 2026 |
| iShares Trust-iShares Core S&P 500 ETF | 1.34% | 54,790,656 | 8.77B | Sep 29, 2026 |
| Fidelity Concord Street Trust-Fidelity 500 Index Fund | 1.31% | 53,438,268 | 8.55B | Sep 29, 2026 |
| SPDR S&P 500 ETF TRUST-State Street SPDR S&P 500 ETF Trust | 1.25% | 50,865,068 | 8.14B | Sep 29, 2026 |