

Amazon.com, Inc. AMZN
Regular-session close
After hours · Nov 19, 7:59 PM ET
- YTD
- +11.50%
- 1 year
- +15.57%
5D -10.14 (-3.79%)
- Market cap
- 2.78T
- Revenue (ttm)
- 797.46B
- Profit margin
- 16.90%
- EPS (ttm)
- 12.37
- Shares out
- 10.81B
- P/E ratio
- 20.81
- Forward P/E
- 23.56
- YTD return
- +11.50%
- 1-year return
- +15.57%
- 50-day average
- 255.12
- Volume
- 53.12M
- Avg volume
- 39.54M
- Open
- 272.58
- Previous close
- 267.74
- Day's range
- 256.75 – 274.00
- 52-week range
- 196.00 – 287.20
- Beta
- 1.50
- Analysts
- Strong Buy
- Price target
- 326.09 (+26.7%)
- Earnings date
- Feb 4, 2027
Key statistics
- 200-day average
- 244.91
- Enterprise value
- 3.09T
- PEG ratio
- 1.24
- Price / sales
- 3.49
- Price / book
- 4.53
- Revenue growth
- 12.10%
- Free cash flow
- -34.73B
- Total cash
- 114.23B
- Total debt
- 304.84B
- Return on equity
- 27.42%
- Short % of float
- 0.96%
Fundamental scorecard
12 of 25 checks passed on AMZN’s reported financials
12of 25 checks passed
- Value 2 of 5
- Growth 4 of 5
- Profitability 3 of 5
- Financial health 3 of 5
- Dividend 0 of 5
Statements to Sep 30, 2026.
Analyst view
Consensus: strong buy
- Target (low)
- 230.00
- Target (mean)
- 326.09
- Target (high)
- 405.00
- Strong buy14
- Buy45
- Hold3
- Sell0
- Strong sell0
Next earnings
Feb 4, 2027
Expected Feb 4, 2027. Consensus EPS estimate 2.49.
Financials — quick view
Earnings
| Report date | Quarter ending | EPS estimate | EPS reported | Surprise | Surprise % |
|---|---|---|---|---|---|
| Feb 4, 2027 | Dec 30, 2026 | 2.40 | — | — | — |
| Oct 29, 2026 | Sep 30, 2026 | 1.97 | 1.89 | -0.08 | -4.06% |
| Jul 30, 2026 | Jun 30, 2026 | 1.82 | 5.75 | +3.93 | +215.93% |
| Apr 29, 2026 | Mar 31, 2026 | 1.63 | 2.78 | +1.15 | +70.55% |
| Feb 5, 2026 | Dec 31, 2025 | 1.97 | 1.95 | -0.02 | -1.02% |
| Oct 30, 2025 | Sep 30, 2025 | 1.57 | 1.95 | +0.38 | +24.20% |
Upgrades / downgrades
| Date | Firm | Action | From | To |
|---|---|---|---|---|
| Nov 3, 2026 | Freedom Broker | main | Buy | Buy |
| Oct 30, 2026 | UBS | main | Buy | Buy |
| Oct 30, 2026 | Scotiabank | main | Sector Outperform | Sector Outperform |
| Oct 30, 2026 | Telsey Advisory Group | main | Outperform | Outperform |
| Oct 30, 2026 | DA Davidson | main | Neutral | Neutral |
| Oct 30, 2026 | Rosenblatt | main | Buy | Buy |
About Amazon.com, Inc.
Amazon.com, Inc. engages in the retail sale of consumer products, advertising, and subscriptions service through online and physical stores in North America and internationally. The company operates through three segments: North America, International, and Amazon Web Services (AWS). It also manufactures and sells electronic devices, including Kindle, fire tablets, fire TVs, echo, ring, blink, and eero; and develops and produces media content. In addition, the company offers programs that enable sellers to sell their products in its stores; and programs that allow authors, independent publishers, musicians, filmmakers, Twitch streamers, skill and app developers, and others to publish and sell content. Further, it provides compute, storage, Artificial intelligence, database, analytics, machine learning, and other services, as well as advertising services through programs, such as sponsored ads, display, and video advertising. Additionally, the company offers Amazon Prime, a membership program. The company's products offered through its stores include merchandise and content purchased for resale and products offered by third-party sellers. It serves consumers, sellers, developers, enterprises, content creators, advertisers, and employees. The company was incorporated in 1994 and is headquartered in Seattle, Washington.
- Sector
- Consumer Cyclical
- Industry
- Internet Retail
- Country
- United States
- Website
- amazon.com
News
 Peter Thiel Now Has as Much Money in an Argentine Oil Stock as in Amazon. It's Down 23% Since September 30
 Amazon Urges NYC Customers to Oppose Mamdani-Backed Delivery Bill
 Google 2004, Nvidia 1999, Amazon 1997: What $1,000 Invested In Each IPO Would Be Worth Today
 Netflix Stock Hits Multi-Year Low: What's Happening?
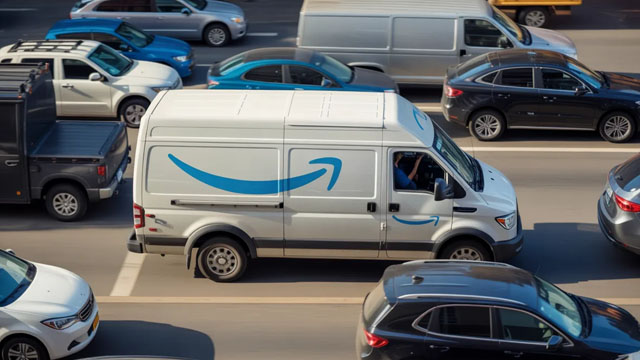 Amazon warns NYC shoppers of potential $5 per-order increase over proposed delivery law
 3 Dirt Cheap Artificial Intelligence (AI) Stocks to Load Up on Before 2027
 Missed the Anthropic IPO? These 3 Stocks Give You Immediate Exposure.
 Amazon brings fight against Mamdani-backed NYC proposal directly to shoppers
 Netflix, Amazon, Fox to bid for 2030 men's World Cup rights; Disney out
 Anthropic Jumps 17% in Record Nasdaq Debut but Fades From $111.50 Open; Alphabet Ticks Up, Amazon Dips
Your note
Sign in to keep a note on AMZN — it syncs with the Stock Master app.
Insider holders
| Insider | Relation | Latest transaction | Date | Shares held |
|---|---|---|---|---|
| BEZOS JEFFREY P | Officer and Director | Stock Gift | Nov 12, 2026 | 883,639,000 |
| GORELICK JAMIE S | Director | Conversion of Exercise of derivative security | Feb 12, 2026 | 50,751 |
| HERRINGTON DOUGLAS J | Officer | Sale | Nov 15, 2026 | 485,901 |
| JASSY ANDREW R. | Chief Executive Officer | Sale | Aug 20, 2026 | 2,311,190 |
| OLSAVSKY BRIAN T. | Chief Financial Officer | Sale | Aug 20, 2026 | 110,835 |
| REYNOLDS SHELLEY L | Officer | Sale | Aug 20, 2026 | 122,436 |
Institution ownership
| Holder | % held | Shares | Value | Reported |
|---|---|---|---|---|
| Blackrock Inc. | 6.92% | 747,880,787 | 192.48B | Sep 29, 2026 |
| Vanguard Capital Management LLC | 5.91% | 638,900,884 | 164.43B | Sep 29, 2026 |
| State Street Corporation | 3.70% | 400,491,637 | 103.07B | Sep 29, 2026 |
| FMR, LLC | 2.98% | 322,644,691 | 83.04B | Sep 29, 2026 |
| Geode Capital Management, LLC | 2.19% | 236,354,202 | 60.83B | Sep 29, 2026 |
| Morgan Stanley | 1.73% | 186,803,618 | 48.08B | Sep 29, 2026 |
Fund ownership
| Holder | % held | Shares | Value | Reported |
|---|---|---|---|---|
| VANGUARD INDEX FUNDS-Vanguard Total Stock Market Index Fund | 2.84% | 307,350,499 | 79.10B | Jun 29, 2026 |
| VANGUARD INDEX FUNDS-Vanguard 500 Index Fund | 2.35% | 253,676,369 | 65.29B | Jun 29, 2026 |
| iShares Trust-iShares Core S&P 500 ETF | 1.21% | 130,790,916 | 33.66B | Sep 29, 2026 |
| Fidelity Concord Street Trust-Fidelity 500 Index Fund | 1.18% | 127,562,485 | 32.83B | Sep 29, 2026 |
| SPDR S&P 500 ETF TRUST-State Street SPDR S&P 500 ETF Trust | 1.12% | 121,442,295 | 31.26B | Sep 29, 2026 |
| Invesco QQQ Trust, Series 1 | 0.75% | 81,609,936 | 21.00B | Sep 29, 2026 |