

Imperial Oil Limited IMO
Regular-session close
After hours · Nov 20, 5:31 PM ET
- YTD
- +34.78%
- 1 year
- +18.81%
5D -9.25 (-7.37%)
- Market cap
- 54.91B
- Revenue (ttm)
- 55.83B
- Profit margin
- 10.88%
- EPS (ttm)
- 9.06
- Shares out
- 472.01M
- P/E ratio
- 12.84
- Forward P/E
- 10.35
- Dividend
- 2.43 (2.08%)
- Ex-dividend date
- Dec 3, 2026
- YTD return
- +34.78%
- 1-year return
- +18.81%
- Volume
- 404.40K
- Avg volume
- 585.92K
- Open
- 115.70
- Previous close
- 116.58
- Day's range
- 115.49 – 118.00
- 52-week range
- 83.72 – 138.33
- Beta
- 0.92
- Analysts
- Underperform
- Price target
- 110.79 (-4.8%)
- Earnings date
- Jan 29, 2027
- 50-day average
- 127.70
Key statistics
- 200-day average
- 125.64
- Enterprise value
- 56.36B
- PEG ratio
- 5.18
- Price / sales
- 0.98
- Price / book
- 3.15
- Payout ratio
- 26.49%
- Revenue growth
- 34.90%
- Free cash flow
- 5.83B
- Total cash
- 2.89B
- Total debt
- 4.23B
- Return on equity
- 25.24%
- Short % of float
- 18.23%
Fundamental scorecard
22 of 25 checks passed on IMO’s reported financials
22of 25 checks passed
- Value 2 of 5
- Growth 5 of 5
- Profitability 5 of 5
- Financial health 5 of 5
- Dividend 5 of 5
Statements to Sep 30, 2026.
Analyst view
Consensus: underperform
- Strong buy0
- Buy1
- Hold8
- Sell6
- Strong sell3
Next earnings
Jan 29, 2027
Expected Jan 29, 2027. Consensus EPS estimate 5.32.
Financials — quick view
Earnings
| Report date | Quarter ending | EPS estimate | EPS reported | Surprise | Surprise % |
|---|---|---|---|---|---|
| Jan 29, 2027 | Dec 30, 2026 | 3.92 | — | — | — |
| Oct 30, 2026 | Sep 30, 2026 | 3.43 | 3.65 | +0.22 | +6.41% |
| Jul 31, 2026 | Jun 30, 2026 | 2.99 | 3.27 | +0.28 | +9.36% |
| May 1, 2026 | Mar 31, 2026 | 1.73 | 1.41 | -0.32 | -18.50% |
| Jan 30, 2026 | Dec 31, 2025 | 1.36 | 1.41 | +0.05 | +3.68% |
| Oct 31, 2025 | Sep 30, 2025 | 1.44 | 1.57 | +0.13 | +9.03% |
Upgrades / downgrades
| Date | Firm | Action | From | To |
|---|---|---|---|---|
| Feb 23, 2026 | RBC Capital | down | Sector Perform | Underperform |
| Sep 25, 2025 | RBC Capital | main | Sector Perform | Sector Perform |
| Jul 23, 2025 | Wolfe Research | down | Outperform | Peer Perform |
| Apr 3, 2025 | RBC Capital | reit | Sector Perform | Sector Perform |
| Jan 3, 2025 | Wolfe Research | down | Outperform | Peer Perform |
| Sep 25, 2024 | Scotiabank | down | Sector Outperform | Sector Perform |
About Imperial Oil Limited
Imperial Oil Limited engages in exploration, production, and sale of crude oil and natural gas in Canada. The company operates in three segments: Upstream, Downstream and Chemical segments. The Upstream segment explores and produces crude oil, natural gas, synthetic crude oil, and bitumen. The Downstream segment transports and refines crude oil; blends refined products; and distributes and markets refined products. This segment also transports crude oil production and third-party crude oil to refineries by contracted and common carrier pipelines; owns and operates refineries; maintains a distribution system to move petroleum products to market by pipeline, tanker, rail, and road transport; owns and operates fuel terminals, natural gas liquids, and products pipelines in Alberta, Manitoba, and Ontario; markets petroleum products under the Esso and Mobil brands; and sells petroleum products, including fuel, asphalt, and lubricants to industrial and transportation customers, independent marketers, resellers, and other refiners, as well as the agriculture, residential heating, and commercial markets through branded fuel and lubricant resellers. The Chemical segment manufactures and markets aliphatic solvents, plasticizer intermediates, and polyethylene resins; and markets refinery grade propylene. It also provides petrochemicals. The company was incorporated in 1880 and is headquartered in Calgary, Canada. Imperial Oil Limited operates as a subsidiary of ExxonMobil Holdings Corporation.
- Sector
- Energy
- Industry
- Oil & Gas Integrated
- Country
- Canada
- Website
- imperialoil.ca
News
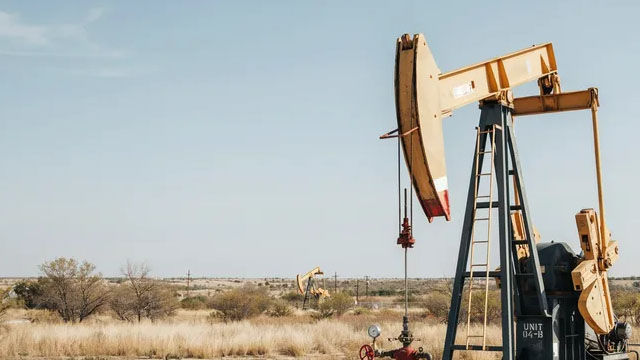 IMO Q3 Earnings Beat on Refining Strength, Revenues Miss
 Here's How Much $100 Invested In Imperial Oil 5 Years Ago Would Be Worth Today
 Imperial Oil Q3 2026 Earnings Call Transcript
 Imperial Oil Q3 Adj. EPS $5.11 Beats $4.70 Estimate, Sales $16.205B Miss $19.059B Estimate
 ExxonMobil, AbbVie On Deck Friday As Energy, Drug Growth Face Test
 Here’s How Much You Would Have Made Owning Imperial Oil Stock In The Last 5 Years
Your note
Sign in to keep a note on IMO — it syncs with the Stock Master app.
Insider holders
| Insider | Relation | Latest transaction | Date | Shares held |
|---|---|---|---|---|
| Ballinger (Robert Edward) | Director or Senior Officer of Insider or Subsidiary of Issuer (other than in 4,5,6) | Acquisition or disposition in the public market | Nov 3, 2026 | 0 |
| Burgess (James Evelyn Richardson) | Senior Officer of Issuer | Acquisition or disposition under a purchase/ownership plan | Dec 30, 2025 | 0 |
| Davie (Matthew Keith Adam) | Director or Senior Officer of Insider or Subsidiary of Issuer (other than in 4,5,6) | Acquisition or disposition under a purchase/ownership plan | Dec 30, 2025 | 0 |
| Eskit (Peter John) | Senior Officer of Issuer | Opening Balance-Initial SEDI Report | May 31, 2026 | 0 |
| Exxon Mobil Corporation | 10% Security Holder of Issuer | Redemption, retraction, cancelation, repurchase | Dec 16, 2025 | 0 |
| ExxonMobil Holdings Corporation | 10% Security Holder of Issuer | Redemption, retraction, cancelation, repurchase | Nov 15, 2026 | 0 |
Institution ownership
| Holder | % held | Shares | Value | Reported |
|---|---|---|---|---|
| FMR, LLC | 8.23% | 38,454,536 | 4.47B | Sep 29, 2026 |
| First Eagle Investment Management, LLC | 2.75% | 12,830,983 | 1.49B | Sep 29, 2026 |
| Goldman Sachs Group Inc | 2.12% | 9,892,984 | 1.15B | Sep 29, 2026 |
| FIL LTD | 1.04% | 4,850,294 | 563.80M | Sep 29, 2026 |
| Vanguard Capital Management LLC | 0.92% | 4,291,047 | 498.79M | Sep 29, 2026 |
| Royal Bank of Canada | 0.86% | 4,036,561 | 469.21M | Sep 29, 2026 |
Fund ownership
| Holder | % held | Shares | Value | Reported |
|---|---|---|---|---|
| First Eagle Funds-First Eagle Global Fund | 1.47% | 6,867,104 | 798.23M | Jul 30, 2026 |
| Fidelity Contrafund | 1.17% | 5,445,659 | 633.00M | Sep 29, 2026 |
| First Eagle Funds-First Eagle Overseas Fund | 0.86% | 4,029,422 | 468.38M | Jul 30, 2026 |
| Fidelity Rutland Square TRT II-Strategic Advisers Fidelity U.S. Total | 0.60% | 2,788,609 | 324.15M | Sep 29, 2026 |
| Fidelity Hastings Street Trust-Fidelity Series Large Cap Stock Fund | 0.44% | 2,036,700 | 236.75M | Sep 29, 2026 |
| VANGUARD STAR FUNDS-Vanguard Total International Stock Index Fund | 0.41% | 1,914,520 | 222.54M | Jul 30, 2026 |