

ExxonMobil Holdings Corporation XOM
At closeNov 12, 2026, 5:36 AM EST
Pre-market · Nov 12, 5:36 AM ET
- YTD
- +38.53%
- 1 year
- +41.14%
- Market cap
- 680.05B
- Revenue (ttm)
- 388.23B
- Profit margin
- 10.46%
- EPS (ttm)
- 9.72
- Shares out
- 4.08B
- P/E ratio
- 17.15
- Forward P/E
- 13.38
- Dividend
- 4.28 (2.60%)
- Ex-dividend date
- Nov 15, 2026
- YTD return
- +38.53%
- 1-year return
- +41.14%
- Volume
- 13.21M
- Avg volume
- 13.61M
- Open
- 165.14
- Previous close
- 164.47
- Day's range
- 164.46 – 166.75
- 52-week range
- 114.19 – 188.50
- Beta
- 0.14
- Analysts
- Buy
- Price target
- 184.50 (+10.7%)
- Earnings date
- Jan 29, 2027
5D -4.84 (-2.82%)
Key statistics
- Enterprise value
- 699.74B
- PEG ratio
- 1.30
- Price / sales
- 1.75
- Price / book
- 2.56
- Dividend yield
- 2.60%
- Payout ratio
- 42.39%
- Revenue growth
- 32.60%
- Free cash flow
- 28.32B
- Total cash
- 12.15B
- Total debt
- 34.25B
- Return on equity
- 15.53%
- Short % of float
- 1.25%
- 50-day average
- 169.06
- 200-day average
- 155.90
Analyst view
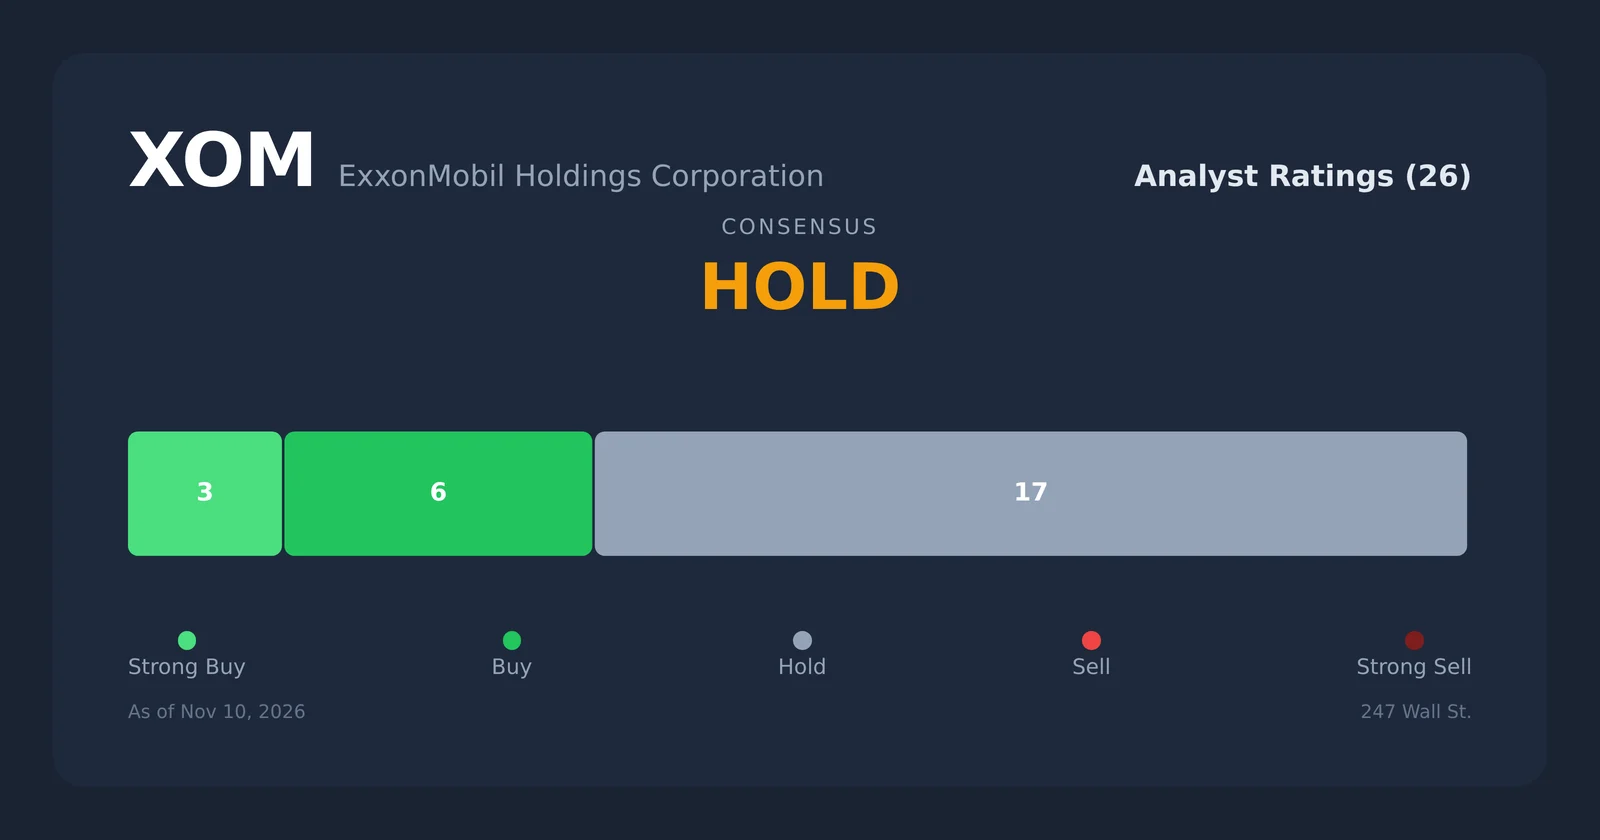
Consensus: buy
- Target (low)
- 160.00
- Target (mean)
- 184.50
- Target (high)
- 213.00
- Strong buy3
- Buy6
- Hold17
- Sell0
- Strong sell0
Next earnings
Jan 29, 2027
Expected Jan 29, 2027. Consensus EPS estimate 4.09.
Financials — quick view
Earnings
| Report date | Quarter ending | EPS estimate | EPS reported | Surprise | Surprise % |
|---|---|---|---|---|---|
| Jan 29, 2027 | Dec 30, 2026 | 4.08 | — | — | — |
| Oct 30, 2026 | Sep 30, 2026 | 4.12 | 4.23 | +0.11 | +2.67% |
| Jul 31, 2026 | Jun 30, 2026 | 3.56 | 3.52 | -0.04 | -1.12% |
| May 1, 2026 | Mar 31, 2026 | 0.984 | 1.16 | +0.18 | +17.89% |
| Jan 30, 2026 | Dec 31, 2025 | 1.70 | 1.71 | +0.01 | +0.59% |
| Oct 31, 2025 | Sep 30, 2025 | 1.82 | 1.88 | +0.06 | +3.30% |
Upgrades / downgrades
| Date | Firm | Action | From | To |
|---|---|---|---|---|
| Nov 6, 2026 | Freedom Broker | main | Hold | Hold |
| Nov 4, 2026 | Citigroup | main | Neutral | Neutral |
| Nov 4, 2026 | TD Cowen | main | Buy | Buy |
| Nov 2, 2026 | UBS | main | Buy | Buy |
| Nov 2, 2026 | Morgan Stanley | main | Overweight | Overweight |
| Nov 2, 2026 | Evercore ISI Group | main | Outperform | Outperform |
About ExxonMobil Holdings Corporation
ExxonMobil Holdings Corporation engages in the exploration and production of crude oil and natural gas in the United States, Canada, and internationally. The company operates through Upstream, Energy Products, Chemical Products, and Specialty Products segments. Its Upstream segment explores for and produces crude oil and natural gas. The Energy Products segment offers fuels, aromatics, and catalysts, as well as licensing services. Its Chemical Products segment manufactures and sells olefins, polyolefins, and intermediates. The Specialty Products segment offers finished lubricants, basestocks, waxes, synthetics, elastomers, and resins. It is also involved in the manufacture, trade, transport, and sale of crude oil, natural gas, petroleum products, petrochemicals, and other specialty products; and pursuit of lower-emission and business opportunities, including carbon capture and storage, hydrogen, lower-emission fuels, Proxxima resin systems, carbon materials, low-carbon data center, and lithium. In addition, the company offers aviation fuel. It sells its products under the Exxon, Esso, and Mobil brands. The company was formerly known as Exxon Mobil Corporation and changed its name to ExxonMobil Holdings Corporation in July 2026. ExxonMobil Holdings Corporation was founded in 1870 and is headquartered in Spring, Texas.
- Sector
- Energy
- Industry
- Oil & Gas Integrated
- Country
- United States
- Website
- corporate.exxonmobil.com
News
 Exxon, Chevron, and Shell Just Reported. Here's What Each One Said About Where Oil Goes Next.
 Exxon files legal challenge to EU carbon capture law, FT reports
 A $1,000 Exxon Stake From Five Years Ago Is Now Worth $3,231, and Shares Are Up More Than a Third in 2026
 Cyclicals Lead Sectors In Wednesday Trading As Defensives Trail
 Treasuries Now Offer 2.66% Above Inflation. Are Dividend Stocks in Trouble?
 Oil Prices Just Fell to Their Lowest Since August as Trump Says the Iran War Is ‘Effectively Over’
 ExxonMobil inks preliminary deal to return to Venezuela after calling the country ‘uninvestable'
 Enbridge vs. ExxonMobil: Which Energy Stock Is a Better Buy for 2027?
 How Much Do You Really Need Invested to Replace a $175,000 Salary With Dividends?
 Democrats Take Congress: 4 Dividend Stocks From Oil to Telecom Worth Buying
Your note
Sign in to keep a note on XOM — it syncs with the Stock Master app.
Institution ownership
| Holder | % held | Shares | Value | Reported |
|---|---|---|---|---|
| Blackrock Inc. | 8.21% | 334,746,496 | 55.78B | Jun 29, 2026 |
| Vanguard Capital Management LLC | 6.64% | 270,731,921 | 45.11B | Jun 29, 2026 |
| State Street Corporation | 5.07% | 206,811,526 | 34.46B | Jun 29, 2026 |
| FMR, LLC | 3.58% | 145,933,748 | 24.32B | Sep 29, 2026 |
| Vanguard Portfolio Management LLC | 2.86% | 116,693,258 | 19.45B | Jun 29, 2026 |
| Geode Capital Management, LLC | 2.45% | 99,964,365 | 16.66B | Sep 29, 2026 |
Fund ownership
| Holder | % held | Shares | Value | Reported |
|---|---|---|---|---|
| VANGUARD INDEX FUNDS-Vanguard Total Stock Market Index Fund | 3.23% | 131,586,172 | 21.93B | Jun 29, 2026 |
| VANGUARD INDEX FUNDS-Vanguard 500 Index Fund | 2.63% | 107,399,224 | 17.90B | Jun 29, 2026 |
| SELECT SECTOR SPDR TRUST-State Street Energy Select Sector SPDR ETF | 1.41% | 57,650,574 | 9.61B | Sep 29, 2026 |
| iShares Trust-iShares Core S&P 500 ETF | 1.34% | 54,790,656 | 9.13B | Sep 29, 2026 |
| Fidelity Concord Street Trust-Fidelity 500 Index Fund | 1.31% | 53,438,268 | 8.90B | Sep 29, 2026 |
| SPDR S&P 500 ETF TRUST-State Street SPDR S&P 500 ETF Trust | 1.25% | 50,865,068 | 8.48B | Sep 29, 2026 |