

Constellation Energy Corporation CEG
At closeNov 12, 2026, 4:28 AM EST
Pre-market · Nov 12, 4:28 AM ET
- YTD
- -22.23%
- 1 year
- -21.88%
- Market cap
- 96.60B
- Revenue (ttm)
- 34.25B
- Profit margin
- 12.76%
- EPS (ttm)
- 12.44
- Shares out
- 351.61M
- P/E ratio
- 22.08
- Forward P/E
- 20.49
- Dividend
- 1.71 (0.64%)
- Ex-dividend date
- Nov 15, 2026
- YTD return
- -22.23%
- 1-year return
- -21.88%
- Volume
- 2.77M
- Avg volume
- 3.48M
- Open
- 272.73
- Previous close
- 267.76
- Day's range
- 267.81 – 276.67
- 52-week range
- 228.63 – 380.78
- Beta
- 1.13
- Analysts
- Buy
- Price target
- 337.90 (+23.0%)
- Earnings date
- Nov 9, 2026
5D +33.21 (+13.75%)
Key statistics
- Enterprise value
- 117.26B
- PEG ratio
- 3.74
- Price / sales
- 2.82
- Price / book
- 2.95
- Dividend yield
- 0.64%
- Payout ratio
- 13.40%
- Revenue growth
- 45.40%
- Free cash flow
- -5.37B
- Total cash
- 603.00M
- Total debt
- 23.39B
- Return on equity
- 18.34%
- Short % of float
- 3.34%
- 50-day average
- 269.87
- 200-day average
- 278.54
Analyst view
Consensus: buy
- Target (low)
- 238.00
- Target (mean)
- 337.90
- Target (high)
- 399.00
- Strong buy6
- Buy14
- Hold5
- Sell0
- Strong sell0
Next earnings
Nov 9, 2026
Expected Nov 9, 2026. Consensus EPS estimate 2.98.
Financials — quick view
Earnings
| Report date | Quarter ending | EPS estimate | EPS reported | Surprise | Surprise % |
|---|---|---|---|---|---|
| Nov 9, 2026 | Sep 30, 2026 | 3.88 | — | — | — |
| Aug 6, 2026 | Jun 30, 2026 | 2.29 | 2.55 | +0.26 | +11.35% |
| May 11, 2026 | Mar 31, 2026 | 2.56 | 2.74 | +0.18 | +7.03% |
| Feb 24, 2026 | Dec 31, 2025 | 2.28 | 2.30 | +0.02 | +0.88% |
| Nov 7, 2025 | Sep 30, 2025 | 3.11 | 3.04 | -0.07 | -2.25% |
| Aug 7, 2025 | Jun 30, 2025 | 1.84 | 1.91 | +0.07 | +3.80% |
Upgrades / downgrades
| Date | Firm | Action | From | To |
|---|---|---|---|---|
| Oct 30, 2026 | Morgan Stanley | main | Overweight | Overweight |
| Oct 28, 2026 | CIBC | main | Outperformer | Outperformer |
| Oct 28, 2026 | Wells Fargo | main | Overweight | Overweight |
| Oct 27, 2026 | TD Cowen | main | Buy | Buy |
| Oct 27, 2026 | Barclays | main | Overweight | Overweight |
| Oct 22, 2026 | HSBC | init | — | Buy |
About Constellation Energy Corporation
Constellation Energy Corporation produces and sells energy products and services in the United States. The company operates through five segments: Mid-Atlantic, Midwest, New York, ERCOT, and Other Power Regions. It offers electricity, natural gas, energy-related products, and sustainable solutions. The company has approximately 31,676 megawatts of generating capacity consisting of nuclear, wind, solar, natural gas, and hydroelectric assets. It serves distribution utilities, municipalities, cooperatives, and commercial, industrial, public sector, and residential customers. The company was incorporated in 2021 and is headquartered in Baltimore, Maryland.
- Sector
- Utilities
- Industry
- Utilities - Independent Power Producers
- Country
- United States
- Website
- constellationenergy.com
News
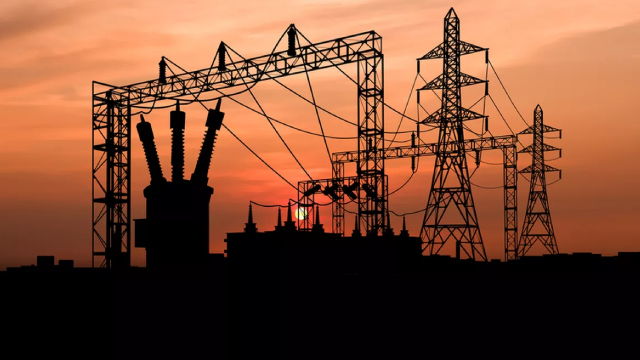 Can Constellation Energy's Contracts Power a Stock Rebound?
 Constellation Q3 Earnings Call Highlights Long-Term Nuclear Contracts
 US power demand to beat record highs in 2026 and 2027 as AI use surges, EIA says
 America Has 6–7 Years of Untapped Power for AI Data Centers, Constellation CEO Says
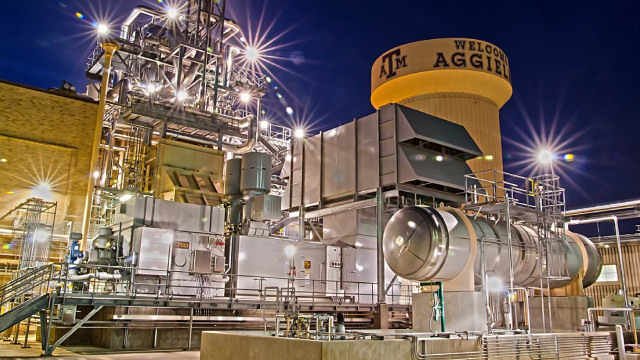 Constellation and Vistra Get the Headlines. These 2 Power Producers Barely Get Mentioned.
 Corning to Caterpillar: The AI ‘Picks and Shovels’ Trade Caves In
 Constellation Has Done Something ‘Unseen’ in the Power Industry, CEO Says
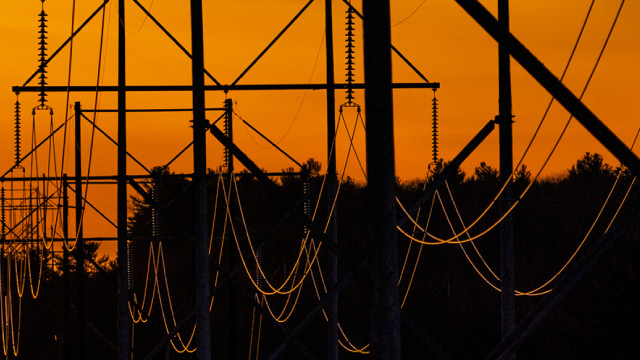 AI Is Creating a Power Crisis. Constellation Energy Just Showed How It Plans to Cash In.
 3 AI Power Stocks to Buy in November
 The Power Behind AI Pays a Dividend: 3 Utility ETFs Yielding Up to 2.77%
Your note
Sign in to keep a note on CEG — it syncs with the Stock Master app.
Insider holders
| Insider | Relation | Latest transaction | Date | Shares held |
|---|---|---|---|---|
| BARRON KATHLEEN | Officer | Conversion of Exercise of derivative security | Oct 28, 2025 | 39,749 |
| DARDIS DAVID O | General Counsel | Conversion of Exercise of derivative security | Feb 8, 2026 | 27,803 |
| DE BALMANN YVES C | Director | Stock Award(Grant) | Apr 27, 2026 | 52,179 |
| DOMINGUEZ JOSEPH | Chief Executive Officer | Conversion of Exercise of derivative security | Feb 8, 2026 | 121,360 |
| EGGERS DANIEL L. | Chief Financial Officer | Conversion of Exercise of derivative security | Feb 8, 2026 | 32,967 |
| HANSON BRYAN CRAIG | Officer | Conversion of Exercise of derivative security | Feb 8, 2026 | 67,813 |
Institution ownership
| Holder | % held | Shares | Value | Reported |
|---|---|---|---|---|
| Blackrock Inc. | 6.98% | 24,555,970 | 6.75B | Jun 29, 2026 |
| Vanguard Capital Management LLC | 5.98% | 21,037,547 | 5.78B | Jun 29, 2026 |
| State Street Corporation | 5.52% | 19,411,636 | 5.33B | Jun 29, 2026 |
| Vanguard Portfolio Management LLC | 4.50% | 15,831,891 | 4.35B | Jun 29, 2026 |
| ECP ControlCo, LLC | 4.09% | 14,370,227 | 3.95B | Jun 29, 2026 |
| Capital International Investors | 3.60% | 12,657,149 | 3.48B | Jun 29, 2026 |
Fund ownership
| Holder | % held | Shares | Value | Reported |
|---|---|---|---|---|
| VANGUARD INDEX FUNDS-Vanguard Total Stock Market Index Fund | 2.93% | 10,294,911 | 2.83B | Jun 29, 2026 |
| WASHINGTON MUTUAL INVESTORS FUND | 2.40% | 8,438,439 | 2.32B | Sep 29, 2026 |
| VANGUARD INDEX FUNDS-Vanguard 500 Index Fund | 2.36% | 8,284,596 | 2.28B | Jun 29, 2026 |
| Invesco QQQ Trust, Series 1 | 2.10% | 7,400,694 | 2.03B | Sep 29, 2026 |
| VANGUARD INDEX FUNDS-Vanguard Mid-Cap Index Fund | 2.00% | 7,026,185 | 1.93B | Jun 29, 2026 |
| SELECT SECTOR SPDR TRUST-State Street Utilities Select Sector SPDR ETF | 1.66% | 5,831,002 | 1.60B | Sep 29, 2026 |