

SK hynix Inc. SKHY
At closeNov 13, 2026, 4:18 AM EST
Pre-market · Nov 13, 4:18 AM ET
- YTD
- -18.03%
- 1 year
- -18.03%
- Market cap
- 971.09B
- Revenue (ttm)
- 269.34T
- Profit margin
- 70.27%
- EPS (ttm)
- 15.68
- Shares out
- 7.05B
- P/E ratio
- 8.78
- Forward P/E
- 3.33
- Dividend
- 0.11 (0.08%)
- Ex-dividend date
- Aug 30, 2026
- YTD return
- -18.03%
- 1-year return
- -18.03%
- Volume
- 14.66M
- Avg volume
- 20.90M
- Open
- 134.25
- Previous close
- 142.25
- Day's range
- 134.05 – 139.56
- 52-week range
- 122.20 – 199.87
- Beta
- 2.47
- Analysts
- Strong Buy
- Price target
- 259.50 (+88.4%)
- Earnings date
- Jan 28, 2027
5D +11.50 (+9.11%)
Key statistics
- Enterprise value
- -97.63T
- PEG ratio
- 0.18
- Price / sales
- 0.00
- Price / book
- 4.27
- Dividend yield
- 0.08%
- Payout ratio
- 0.00%
- Revenue growth
- 327.90%
- Free cash flow
- 0
- Total cash
- 114.46T
- Total debt
- 15.80T
- Return on equity
- 92.54%
- Short % of float
- 0.00%
- 50-day average
- 165.19
- 200-day average
- 161.19
Analyst view
Consensus: strong buy
- Target (low)
- 164.00
- Target (mean)
- 259.50
- Target (high)
- 400.00
- Strong buy6
- Buy9
- Hold0
- Sell0
- Strong sell0
Next earnings
Jan 28, 2027
Expected Jan 28, 2027. Consensus EPS estimate 8.68.
Financials — quick view
Earnings
| Report date | Quarter ending | EPS estimate | EPS reported | Surprise | Surprise % |
|---|---|---|---|---|---|
| Jan 28, 2027 | Dec 30, 2026 | 8.41 | — | — | — |
| Oct 27, 2026 | Sep 30, 2026 | 5.96 | 4.01 | -1.95 | -32.72% |
| Jul 28, 2026 | Jun 30, 2026 | 5.12 | 8.76 | +3.64 | +71.09% |
| Apr 22, 2026 | Mar 31, 2026 | 2.55 | 3.83 | +1.28 | +50.20% |
| Jan 28, 2026 | Dec 31, 2025 | 1.22 | 1.45 | +0.23 | +18.85% |
| Oct 28, 2025 | Sep 30, 2025 | 0.902 | 1.25 | +0.35 | +38.58% |
Upgrades / downgrades
| Date | Firm | Action | From | To |
|---|---|---|---|---|
| Oct 28, 2026 | RBC Capital | reit | Outperform | Outperform |
| Oct 28, 2026 | Rosenblatt | main | Buy | Buy |
| Oct 28, 2026 | Cantor Fitzgerald | reit | Overweight | Overweight |
| Oct 28, 2026 | Needham | main | Buy | Buy |
| Oct 26, 2026 | Cantor Fitzgerald | main | Overweight | Overweight |
| Sep 10, 2026 | JP Morgan | init | — | Overweight |
About SK hynix Inc.
SK hynix Inc. through its subsidiaries, engages in research, develops, manufactures, distributes, and sells semiconductor devices in Korea, China, rest of Asia, the United States, Europe, and internationally. It offers DRAM, such as server memory, graphics memory, mobile memory, PC memory, consumer memory; NAND flash memory; SSD; and MCP products. It also engages in foundry business, produces non-memory semiconductors. The company serves its products for server, networking, mobile, personal computer, consumer, and automotive applications. The company was formerly known as Hynix Semiconductor Inc. and changed its name to SK hynix Inc. in March 2012. SK hynix Inc. was incorporated in 1949 and is headquartered in Icheon-si, South Korea.
- Sector
- Technology
- Industry
- Semiconductors
- Country
- South Korea
- Website
- skhynix.com
News
 SK Hynix Stocks Slip 1.8% as NVIDIA Exposure Turns From Asset to Risk
 Sandisk, Micron, and SK Hynix Slide 3% as NVIDIA Shake-Up Hits Memory Stocks
 Nvidia vs. SK Hynix: Which AI Chip Stock Is a Better Buy for 2027?
 SK hynix Rides the AI Data Center Boom and HBM4 Ramp-Up
 QUICK SPARK: CoreWeave, 16 Other AI Stocks Are Up More Than 10% on Wednesday
 Tech Stocks Add Over $500 Billion as CoreWeave's Blockbuster Results Rescue AI Rally
 Riskified, CoreWeave, Micron And Other Big Stocks Moving Higher On Wednesday
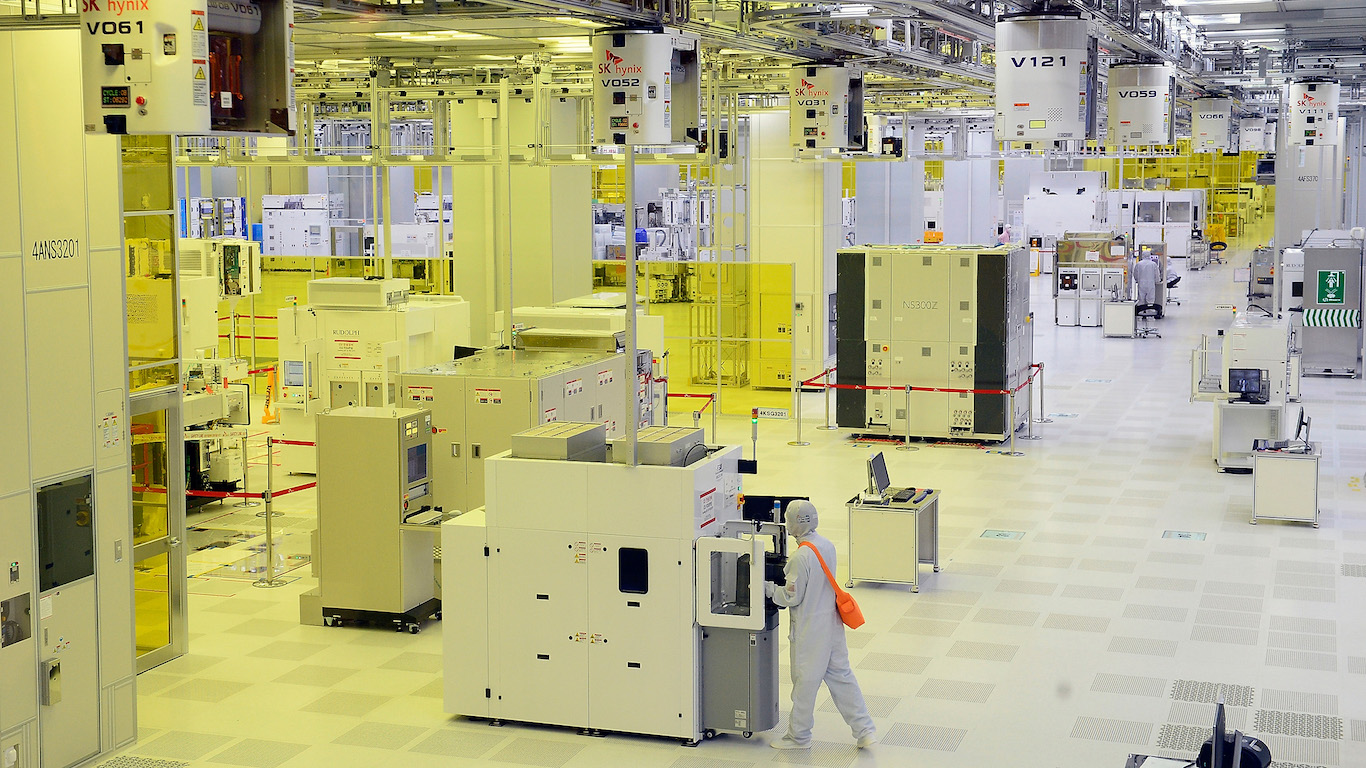 SK Hynix Crumbled 25% Over The Last Month: 200% Returns Are a Distinct Possibility According to This Wall Street Firm
 Micron, Sandisk, SK Hynix stocks surge after CoreWeave earnings: here's why
 Intel vs. SK Hynix: Which Technology Stock Is a Better Buy?
Your note
Sign in to keep a note on SKHY — it syncs with the Stock Master app.
Institution ownership
| Holder | % held | Shares | Value | Reported |
|---|---|---|---|---|
| FMR, LLC | 0.10% | 7,224,892 | 994.94M | Sep 29, 2026 |
| UBS Group AG | 0.08% | 5,848,927 | 805.46M | Sep 29, 2026 |
| WCM Investment Management, LLC | 0.06% | 4,611,171 | 635.00M | Sep 29, 2026 |
| Bessemer Group, Inc. | 0.02% | 1,228,350 | 169.16M | Sep 29, 2026 |
| Exchange Traded Concepts LLC | 0.01% | 850,133 | 117.07M | Sep 29, 2026 |
| Pictet Asset Management Holding SA | 0.01% | 379,203 | 52.22M | Sep 29, 2026 |
Fund ownership
| Holder | % held | Shares | Value | Reported |
|---|---|---|---|---|
| VanEck ETF Trust-VanEck Semiconductor ETF | 0.24% | 17,801,800 | 2.45B | Sep 29, 2026 |
| iShares Trust-iShares Semiconductor ETF | 0.11% | 7,960,098 | 1.10B | Sep 29, 2026 |
| NEW PERSPECTIVE FUND | 0.06% | 4,029,278 | 554.87M | Sep 29, 2026 |
| Direxion Shares ETF Trust-Direxion Daily Semiconductor Bull 3X ETF | 0.04% | 2,765,183 | 380.79M | Sep 29, 2026 |
| AMERICAN FUNDS INSURANCE SERIES-Eupac Fund | 0.02% | 1,217,984 | 167.73M | Sep 29, 2026 |
| BlackRock ETF Trust-iShares International Country Rotation Active ETF | 0.01% | 927,994 | 127.79M | Sep 29, 2026 |