

State Street SPDR S&P Homebuilders ETF XHB
97.89 USD -2.86 (-2.84%)
Regular-session close
97.89 0.00 0.00%
After hours · Nov 19, 4:00 PM ET
97.69 Day range 100.48
91.87 52-week range 123.13
- YTD
- -4.92%
- 1 year
- -1.93%
5D -3.54 (-3.43%)
- Assets
- $1.51B
- Expense ratio
- 0.35%
- NAV
- 100.98
- Holdings
- 34
- Top 10 weight
- 37.1%
- Asset class
- Equity
- Issuer
- SPDR
- Inception
- Jan 31, 2006
- YTD return
- -4.92%
- 1-year return
- -1.93%
- Volume
- 1.80M
- Avg volume
- 2.03M
- Open
- 100.44
- Previous close
- 100.75
- Day's range
- 97.69 – 100.48
- 52-week range
- 91.87 – 123.13
- 50-day average
- 98.46
- 200-day average
- 104.55
About State Street SPDR S&P Homebuilders ETF
In seeking to track the performance of the S&P Homebuilders Select Industry Index (the "index"), the fund employs a sampling strategy. It generally invests substantially all, but at least 80%, of its total assets in the securities comprising the index. The index represents the homebuilders segment of the S&P Total Market Index ("S&P TMI").
News
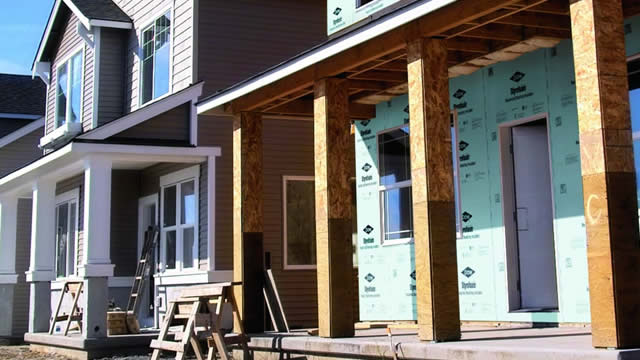 Homebuilder Confidence Just Fell to Its Lowest Since 2012
 US homebuilder sentiment tumbles to more than 14-1/2-year low in November
 Homebuilder sentiment plunges to 14-year low, leading more builders to drop prices
 Is State Street SPDR S&P Homebuilders ETF (XHB) a Strong ETF Right Now?
 Peter Schiff’s Chilling Warning: ‘Get Ready for the Mother of All Housing Crashes’
 Americans Are Cashing In on Home Equity at the Fastest Pace Since the Financial Crisis
 Hot CPI Pushes 10-Year Yield to 5%, Nvidia Sinks 6%: Stock Market Today
 What an Empty Wine Glass Says About the Next Recession
 Dow Rallies 2.9%, Oil Sinks 7% After Midterms: Stock Market Today
 Nasdaq 100 Gets a Lift As Nvidia Overtakes Apple: Stock Market Today
Your note
Sign in to keep a note on XHB — it syncs with the Stock Master app.