

Union Pacific Corporation UNP
At closeNov 11, 2026, 4:44 AM EST
Pre-market · Nov 11, 4:44 AM ET
- YTD
- +29.96%
- 1 year
- +34.28%
- Market cap
- 178.59B
- Revenue (ttm)
- 26.36B
- Profit margin
- 28.90%
- EPS (ttm)
- 12.82
- Shares out
- 594.08M
- P/E ratio
- 23.45
- Forward P/E
- 20.88
- Dividend
- 5.68 (1.91%)
- Ex-dividend date
- Aug 30, 2026
- YTD return
- +29.96%
- 1-year return
- +34.28%
- Volume
- 2.07M
- Avg volume
- 2.51M
- Open
- 297.62
- Previous close
- 297.01
- Day's range
- 294.94 – 301.32
- 52-week range
- 219.89 – 315.99
- Beta
- 0.84
- Analysts
- Buy
- Price target
- 329.96 (+9.8%)
- Earnings date
- Jan 26, 2027
5D -5.08 (-1.66%)
Key statistics
- Enterprise value
- 204.52B
- PEG ratio
- 2.80
- Price / sales
- 6.77
- Price / book
- 8.11
- Dividend yield
- 1.91%
- Payout ratio
- 43.37%
- Revenue growth
- 15.30%
- Free cash flow
- 5.07B
- Total cash
- 3.09B
- Total debt
- 31.11B
- Return on equity
- 38.75%
- Short % of float
- 5.23%
- 50-day average
- 286.49
- 200-day average
- 272.54
Analyst view
Consensus: buy
- Target (low)
- 245.00
- Target (mean)
- 329.96
- Target (high)
- 375.00
- Strong buy3
- Buy15
- Hold6
- Sell0
- Strong sell1
Next earnings
Jan 26, 2027
Expected Jan 26, 2027. Consensus EPS estimate 3.31.
Financials — quick view
Earnings
| Report date | Quarter ending | EPS estimate | EPS reported | Surprise | Surprise % |
|---|---|---|---|---|---|
| Jan 26, 2027 | Dec 30, 2026 | 3.31 | — | — | — |
| Oct 22, 2026 | Sep 30, 2026 | 3.47 | 3.53 | +0.06 | +1.73% |
| Jul 23, 2026 | Jun 30, 2026 | 3.26 | 3.41 | +0.15 | +4.60% |
| Apr 23, 2026 | Mar 31, 2026 | 2.86 | 2.93 | +0.07 | +2.45% |
| Jan 27, 2026 | Dec 31, 2025 | 2.86 | 2.86 | 0.00 | 0.00% |
| Oct 23, 2025 | Sep 30, 2025 | 2.99 | 3.08 | +0.09 | +3.01% |
Upgrades / downgrades
| Date | Firm | Action | From | To |
|---|---|---|---|---|
| Nov 5, 2026 | Baird | down | Outperform | Neutral |
| Oct 27, 2026 | Susquehanna | main | Positive | Positive |
| Oct 23, 2026 | Citigroup | main | Buy | Buy |
| Oct 23, 2026 | JP Morgan | main | Neutral | Neutral |
| Oct 23, 2026 | Evercore ISI Group | main | Outperform | Outperform |
| Oct 23, 2026 | RBC Capital | main | Outperform | Outperform |
About Union Pacific Corporation
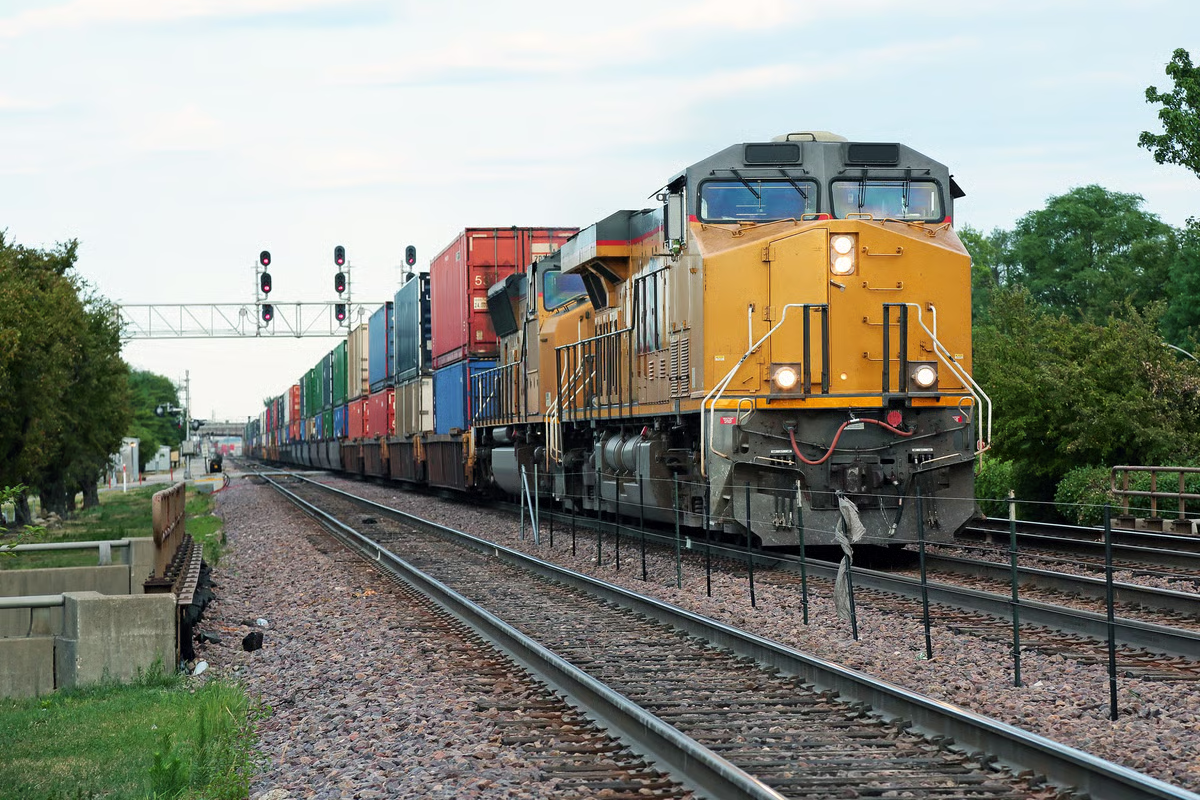
Union Pacific Corporation, through its subsidiary, Union Pacific Railroad Company, operates in the railroad business in the United States. It offers transportation services for grain and grain products, fertilizers, food and refrigerated products, and coal and renewables to grain processors, animal feeders, and ethanol and renewable biofuel producers; and construction products, industrial chemicals, plastics, forest products, specialized products, metals and ores, petroleum, liquid petroleum gases, soda ash, and sand, as well as finished automobiles, automotive parts, and merchandise in intermodal containers. The company was founded in 1862 and is headquartered in Omaha, Nebraska.
- Sector
- Industrials
- Industry
- Railroads
- Country
- United States
- Website
- up.com
News
 Union Pacific (UNP) Just Overtook the 20-Day Moving Average
 Union Pacific Corporation $UNP Stock Sold by CenterBook Partners LP
 3 Railroad Stocks to Consider From the Prospering Industry
 argenx to Acquire Unnatural Products, Inc., Adding Peptide Discovery Engine to Broaden Immunology Capabilities
 How These 4 Transportation Stocks Move the Economy
 Union Pacific vs. CSX: Which Railroad Dividend Is Better for Retirement?
 Here’s How Much You Would Have Made Owning Union Pacific Stock In The Last 20 Years
 This Cisco Analyst Is No Longer Bullish; Here Are Top 5 Downgrades For Thursday
 Baird Downgrades Union Pacific to Neutral, Lowers Price Target to $310
 18,787 Union Pacific Corporation $UNP Shares Sold by Boston Trust Walden Corp
Your note
Sign in to keep a note on UNP — it syncs with the Stock Master app.
Insider holders
| Insider | Relation | Latest transaction | Date | Shares held |
|---|---|---|---|---|
| CONLIN CHRISTINA B | Officer | Stock Award(Grant) | Oct 8, 2026 | 16,016 |
| GEHRINGER ERIC J. | Officer | Stock Award(Grant) | Jun 9, 2026 | 56,087 |
| HAMANN JENNIFER L | Chief Financial Officer | Stock Award(Grant) | Sep 9, 2026 | 120,398 |
| JALALI RAHUL | Chief Technology Officer | Stock Award(Grant) | Sep 9, 2026 | 33,136 |
| POWERS CARRIE J. | Officer | Stock Award(Grant) | Oct 8, 2026 | 9,125 |
| RICHARDSON CRAIG V | Officer | Stock Award(Grant) | Mar 9, 2025 | 28,079 |
Institution ownership
| Holder | % held | Shares | Value | Reported |
|---|---|---|---|---|
| Blackrock Inc. | 8.06% | 47,894,147 | 14.40B | Jun 29, 2026 |
| Vanguard Capital Management LLC | 6.52% | 38,772,919 | 11.66B | Jun 29, 2026 |
| State Street Corporation | 4.69% | 27,890,598 | 8.38B | Jun 29, 2026 |
| Capital World Investors | 4.57% | 27,141,622 | 8.16B | Jun 29, 2026 |
| Capital Research Global Investors | 2.88% | 17,112,417 | 5.14B | Jun 29, 2026 |
| Geode Capital Management, LLC | 2.82% | 16,777,136 | 5.04B | Sep 29, 2026 |
Fund ownership
| Holder | % held | Shares | Value | Reported |
|---|---|---|---|---|
| VANGUARD INDEX FUNDS-Vanguard Total Stock Market Index Fund | 3.17% | 18,847,724 | 5.67B | Jun 29, 2026 |
| VANGUARD INDEX FUNDS-Vanguard 500 Index Fund | 2.59% | 15,384,227 | 4.62B | Jun 29, 2026 |
| AMERICAN BALANCED FUND | 1.67% | 9,948,749 | 2.99B | Sep 29, 2026 |
| iShares Trust-iShares Core S&P 500 ETF | 1.33% | 7,915,594 | 2.38B | Sep 29, 2026 |
| Fidelity Concord Street Trust-Fidelity 500 Index Fund | 1.30% | 7,720,571 | 2.32B | Sep 29, 2026 |
| SPDR S&P 500 ETF TRUST-State Street SPDR S&P 500 ETF Trust | 1.24% | 7,355,708 | 2.21B | Sep 29, 2026 |