

Macy's, Inc. M
At closeNov 3, 2026, 7:56 PM EST
After hours · Nov 3, 7:56 PM ET
- YTD
- +8.30%
- 1 year
- +19.76%
- Market cap
- 6.24B
- Revenue (ttm)
- 22.78B
- Profit margin
- 3.29%
- EPS (ttm)
- 2.68
- Shares out
- 261.18M
- P/E ratio
- 8.91
- Forward P/E
- 10.08
- Dividend
- 0.77 (3.15%)
- Ex-dividend date
- Dec 14, 2026
- YTD return
- +8.30%
- 1-year return
- +19.76%
- Volume
- 4.62M
- Avg volume
- 6.13M
- Open
- 24.42
- Previous close
- 24.33
- Day's range
- 23.70 – 24.45
- 52-week range
- 16.69 – 26.59
- Beta
- 1.43
- Analysts
- Hold
- Price target
- 23.10 (-3.3%)
- Earnings date
- Dec 2, 2026
2Y +8.67 (+57.00%)
Key statistics
- Enterprise value
- 10.15B
- PEG ratio
- 2.83
- Price / sales
- 0.27
- Price / book
- 1.27
- Dividend yield
- 3.15%
- Payout ratio
- 27.39%
- Revenue growth
- 1.20%
- Free cash flow
- 605.00M
- Total cash
- 1.29B
- Total debt
- 5.09B
- Return on equity
- 15.99%
- Short % of float
- 14.84%
- 50-day average
- 22.82
- 200-day average
- 21.67
Analyst view
Consensus: hold
- Target (low)
- 10.00
- Target (mean)
- 23.10
- Target (high)
- 30.00
- Strong buy1
- Buy1
- Hold9
- Sell1
- Strong sell0
Next earnings
Dec 2, 2026
Expected Dec 2, 2026. Consensus EPS estimate -0.1807.
Financials — quick view
Earnings
| Report date | Quarter ending | EPS estimate | EPS reported | Surprise | Surprise % |
|---|---|---|---|---|---|
| Dec 2, 2026 | Nov 1, 2026 | -0.18052 | — | — | — |
| Sep 10, 2026 | Aug 1, 2026 | 0.3706 | 0.63 | +0.26 | +69.99% |
| Jun 3, 2026 | May 2, 2026 | 0.03064 | 0.13 | +0.10 | +324.28% |
| Mar 18, 2026 | Jan 31, 2026 | 1.53 | 1.67 | +0.14 | +9.15% |
| Dec 3, 2025 | Nov 1, 2025 | -0.13081 | 0.09 | +0.22 | +168.80% |
| Sep 3, 2025 | Aug 2, 2025 | 0.19 | 0.41 | +0.22 | +115.79% |
Upgrades / downgrades
| Date | Firm | Action | From | To |
|---|---|---|---|---|
| Sep 11, 2026 | BTIG | reit | Neutral | Neutral |
| Aug 26, 2026 | UBS | main | Sell | Sell |
| Aug 25, 2026 | Citigroup | main | Neutral | Neutral |
| Jun 22, 2026 | TD Cowen | main | Hold | Hold |
| Jun 4, 2026 | Telsey Advisory Group | main | Market Perform | Market Perform |
| Jun 4, 2026 | Citigroup | main | Neutral | Neutral |
About Macy's, Inc.
Macy's, Inc., an omni-channel retail organization, operates stores, websites, and mobile applications in the United States. The company sells various merchandise, such as apparel and accessories for men, women, and kids; cosmetics; home furnishings; and other consumer goods under the Macy's, Bloomingdale's, and Bluemercury brands. It also operates in Dubai, the United Arab Emirates, and Al Zahra, Kuwait under the license agreements. The company was formerly known as Federated Department Stores, Inc. and changed its name to Macy's, Inc. in June 2007. Macy's, Inc. was founded in 1830 and is based in New York, New York.
- Sector
- Consumer Cyclical
- Industry
- Department Stores
- Country
- United States
- Website
- macysinc.com
News
 Buffett Successor Has Berkshire Hathaway Poised to Beat S&P 500 in 2026: His 3 New Stock Picks Are Helping
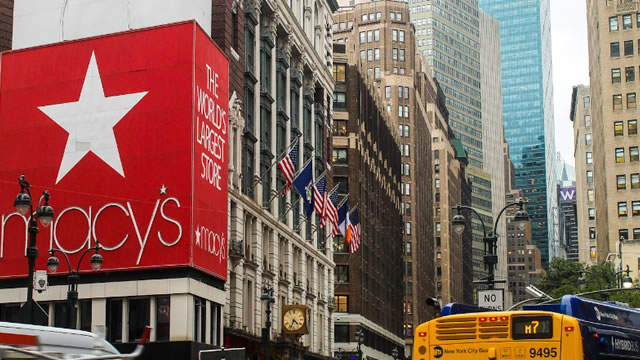 Macy's (M) Registers a Bigger Fall Than the Market: Important Facts to Note
 AstraZeneca results: 9M and Q3 2026
 Myriad Uranium Announces Further Strong Phase II Drill Results from Copper Mountain
 Myriad Uranium Corp. to Present at the Red Cloud Fall Mining Showcase
 Macy's Unwraps the Magic of Holiday Gifting
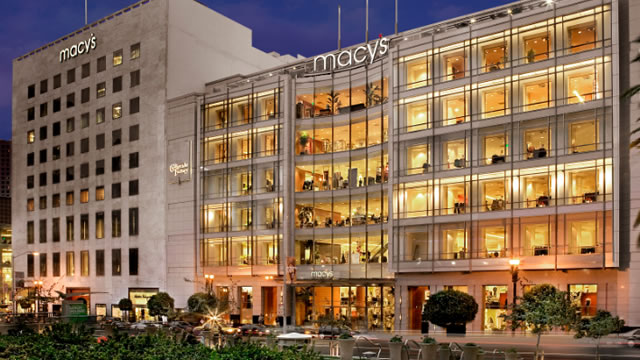 Macy's (M) Stock Falls Amid Market Uptick: What Investors Need to Know
 Macy's, Inc. Board of Directors Declares Quarterly Dividend
 There's Magic Inside Macy's This Holiday Season
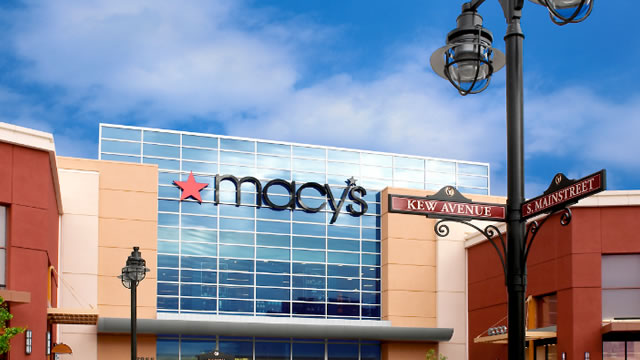 Are Investors Undervaluing Macy's (M) Right Now?
Your note
Sign in to keep a note on M — it syncs with the Stock Master app.
Insider holders
| Insider | Relation | Latest transaction | Date | Shares held |
|---|---|---|---|---|
| BRON OLIVIER | Officer | Conversion of Exercise of derivative security | Oct 29, 2026 | 31,318 |
| EDWARDS THOMAS J JR | Chief Operating Officer | Sale | Jun 23, 2026 | 20,000 |
| GRISCOM PAUL | Officer | Sale | Jun 24, 2026 | 25,373 |
| KIRGAN DANIELLE L | Officer | Sale | Apr 5, 2026 | 108,008 |
| MITCHELL ADRIAN V. | Chief Operating Officer | Sale | Mar 31, 2025 | 236,201 |
| PRESTON TRACY M | Officer | Sale | Apr 5, 2026 | 28,773 |
Institution ownership
| Holder | % held | Shares | Value | Reported |
|---|---|---|---|---|
| Blackrock Inc. | 10.82% | 28,261,769 | 675.17M | Jun 29, 2026 |
| Dimensional Fund Advisors LP | 6.43% | 16,800,787 | 401.37M | Jun 29, 2026 |
| Vanguard Portfolio Management LLC | 4.93% | 12,863,362 | 307.31M | Jun 29, 2026 |
| American Century Companies Inc | 4.22% | 11,030,537 | 263.52M | Jun 29, 2026 |
| Vanguard Capital Management LLC | 4.22% | 11,020,211 | 263.27M | Jun 29, 2026 |
| Charles Schwab Investment Management, Inc. | 3.75% | 9,800,523 | 234.13M | Jun 29, 2026 |
Fund ownership
| Holder | % held | Shares | Value | Reported |
|---|---|---|---|---|
| American Century ETF Trust-Avantis U.S. Small Cap Value ETF | 3.87% | 10,097,966 | 241.24M | Sep 29, 2026 |
| iShares Trust-iShares Core S&P Mid-Cap ETF | 3.59% | 9,370,972 | 223.87M | Sep 29, 2026 |
| VANGUARD INDEX FUNDS-Vanguard Total Stock Market Index Fund | 2.89% | 7,537,315 | 180.07M | Jun 29, 2026 |
| SCHWAB STRATEGIC TRUST-Schwab US Dividend Equity ETF | 2.77% | 7,223,549 | 172.57M | Aug 30, 2026 |
| VANGUARD INDEX FUNDS-Vanguard Small-Cap Index Fund | 2.09% | 5,446,413 | 130.11M | Jun 29, 2026 |
| DFA INVESTMENT DIMENSIONS GROUP INC-U.S. Small Cap Value Portfolio | 1.40% | 3,650,546 | 87.21M | Jul 30, 2026 |