

Applied Materials, Inc. AMAT
At closeNov 10, 2026, 7:56 PM EST
After hours · Nov 10, 7:56 PM ET
- YTD
- +44.96%
- 1 year
- +58.47%
- Market cap
- 295.64B
- Revenue (ttm)
- 30.84B
- Profit margin
- 30.05%
- EPS (ttm)
- 11.59
- Shares out
- 793.60M
- P/E ratio
- 32.14
- Forward P/E
- 20.08
- Dividend
- 2.12 (0.57%)
- Ex-dividend date
- Nov 18, 2026
- YTD return
- +44.96%
- 1-year return
- +58.47%
- Volume
- 6.34M
- Avg volume
- 7.26M
- Open
- 364.79
- Previous close
- 370.55
- Day's range
- 364.23 – 382.14
- 52-week range
- 203.40 – 739.67
- Beta
- 1.67
- Analysts
- Strong Buy
- Price target
- 620.78 (+66.6%)
- Earnings date
- Nov 12, 2026
5D +3.01 (+0.81%)
Key statistics
- Enterprise value
- 292.18B
- PEG ratio
- 0.70
- Price / sales
- 9.59
- Price / book
- 11.54
- Dividend yield
- 0.57%
- Payout ratio
- 16.48%
- Revenue growth
- 24.80%
- Free cash flow
- 3.08B
- Total cash
- 9.23B
- Total debt
- 7.35B
- Return on equity
- 41.07%
- Short % of float
- 1.79%
- 50-day average
- 443.02
- 200-day average
- 445.60
Analyst view
Consensus: strong buy
- Target (low)
- 358.00
- Target (mean)
- 620.78
- Target (high)
- 900.00
- Strong buy5
- Buy30
- Hold6
- Sell0
- Strong sell0
Next earnings
Nov 12, 2026
Expected Nov 12, 2026. Consensus EPS estimate 4.06.
Financials — quick view
Earnings
| Report date | Quarter ending | EPS estimate | EPS reported | Surprise | Surprise % |
|---|---|---|---|---|---|
| Nov 12, 2026 | Oct 26, 2026 | 4.06 | — | — | — |
| Aug 13, 2026 | Jul 26, 2026 | 3.40 | 3.50 | +0.10 | +2.94% |
| May 14, 2026 | Apr 26, 2026 | 2.68 | 2.86 | +0.18 | +6.72% |
| Feb 12, 2026 | Jan 25, 2026 | 2.21 | 2.38 | +0.17 | +7.69% |
| Dec 12, 2025 | Oct 26, 2025 | 2.11 | 2.17 | +0.06 | +2.84% |
| Aug 14, 2025 | Jul 27, 2025 | 2.36 | 2.48 | +0.12 | +5.08% |
Upgrades / downgrades
| Date | Firm | Action | From | To |
|---|---|---|---|---|
| Nov 9, 2026 | B. Riley Securities | main | Buy | Buy |
| Nov 3, 2026 | Morgan Stanley | main | Equal-Weight | Equal-Weight |
| Oct 16, 2026 | Needham | main | Buy | Buy |
| Oct 15, 2026 | Evercore ISI Group | main | Outperform | Outperform |
| Oct 14, 2026 | RBC Capital | reit | Outperform | Outperform |
| Sep 28, 2026 | Morgan Stanley | main | Equal-Weight | Equal-Weight |
About Applied Materials, Inc.
Applied Materials, Inc. provides materials engineering solutions, equipment, services, and software to the semiconductor and related industries in the United States, China, Korea, Taiwan, Japan, Southeast Asia, Europe, and internationally. The company operates through Semiconductor Systems and Applied Global Services (AGS) segments. The Semiconductor Systems segment includes semiconductor capital equipment to enable materials engineering steps, including etch, rapid thermal processing, deposition, chemical mechanical planarization, metrology and inspection, wafer packaging, and ion implantation. The AGS segment offers integrated solutions to optimize equipment and fab performance and productivity comprising spares, upgrades, services, and 200 millimeter and other equipment and factory automation software for semiconductor and other products. It serves manufacturers of semiconductor wafers and chips, and other electronic devices. Applied Materials, Inc. was incorporated in 1967 and is headquartered in Santa Clara, California.
- Sector
- Technology
- Industry
- Semiconductor Equipment & Materials
- Country
- United States
- Website
- appliedmaterials.com
News
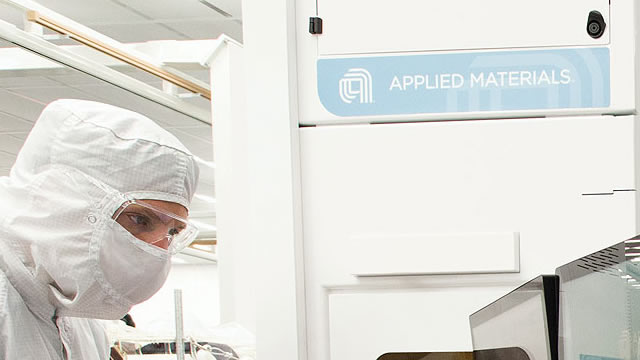 Applied Materials stock: death cross pattern nears ahead of earnings
 Applied Materials vs. Dell Technologies: Comparing Stable vs.
 4 Overlooked Tech Stocks That Pay Dividends and Have Room to Grow
 Nasdaq 100 Jumps 3% as Chips Rebound; Nvidia Lags Most Since DeepSeek: Stock Market Today
 Applied Materials Jumps 11% Ahead of Earnings; Lam Research Surges 9%, ASML Rises 6%
 AI Chatbots' Stock Pick Showdown: Constellation, Applied Materials, Take-Two
 AI Chatbots’ Stock Pick Showdown: Constellation, Applied Materials, Take-Two
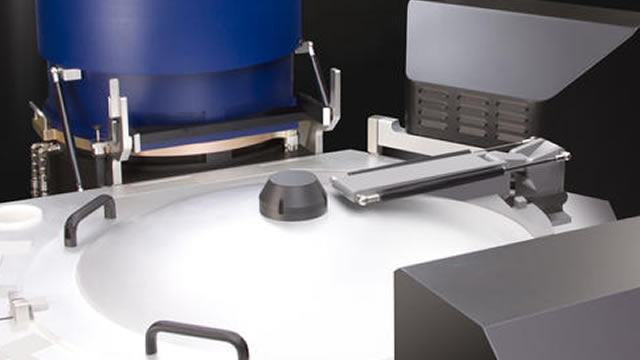 AMAT to Post Q4 Earnings: Time to Buy, Sell or Hold the Stock?
 B. Riley Securities Maintains Buy on Applied Materials, Lowers Price Target to $475
 Chip Stocks Are 38% Off Their Peak: 'Time to Buy the Dip,' Analysts Say
Your note
Sign in to keep a note on AMAT — it syncs with the Stock Master app.
Insider holders
| Insider | Relation | Latest transaction | Date | Shares held |
|---|---|---|---|---|
| BRUNER JUDY | Director | Sale | Sep 7, 2026 | 0 |
| CHEN XUN ERIC | Director | Stock Award(Grant) | Mar 11, 2026 | 45,970 |
| DE GEUS AART J | Director | Stock Gift | May 20, 2026 | 93,928 |
| DEANE TIMOTHY M | Officer | Stock Gift | Jun 14, 2026 | 133,086 |
| DICKERSON GARY E | Chief Executive Officer | Sale | Jun 29, 2026 | 1,599,840 |
| HILL BRICE | Chief Financial Officer | Sale | Aug 24, 2026 | 128,613 |
Institution ownership
| Holder | % held | Shares | Value | Reported |
|---|---|---|---|---|
| Blackrock Inc. | 10.11% | 80,212,518 | 29.88B | Jun 29, 2026 |
| Vanguard Capital Management LLC | 6.53% | 51,848,358 | 19.32B | Jun 29, 2026 |
| State Street Corporation | 4.82% | 38,240,019 | 14.25B | Jun 29, 2026 |
| Invesco Ltd. | 3.56% | 28,265,844 | 10.53B | Jun 29, 2026 |
| Geode Capital Management, LLC | 2.84% | 22,551,514 | 8.40B | Sep 29, 2026 |
| Capital Research Global Investors | 2.79% | 22,159,097 | 8.25B | Jun 29, 2026 |
Fund ownership
| Holder | % held | Shares | Value | Reported |
|---|---|---|---|---|
| VANGUARD INDEX FUNDS-Vanguard Total Stock Market Index Fund | 3.18% | 25,205,514 | 9.39B | Jun 29, 2026 |
| VANGUARD INDEX FUNDS-Vanguard 500 Index Fund | 2.59% | 20,566,194 | 7.66B | Jun 29, 2026 |
| Invesco QQQ Trust, Series 1 | 2.09% | 16,576,367 | 6.18B | Sep 29, 2026 |
| iShares Trust-iShares Core S&P 500 ETF | 1.33% | 10,579,117 | 3.94B | Sep 29, 2026 |
| Fidelity Concord Street Trust-Fidelity 500 Index Fund | 1.30% | 10,318,263 | 3.84B | Sep 29, 2026 |
| SPDR S&P 500 ETF TRUST-State Street SPDR S&P 500 ETF Trust | 1.24% | 9,819,548 | 3.66B | Sep 29, 2026 |