

T-Mobile US, Inc. TMUS
Nov 4, 2026, 2:06 PM EST
- YTD
- -21.52%
- 1 year
- -22.76%
- Market cap
- 168.78B
- Revenue (ttm)
- 93.82B
- Profit margin
- 12.05%
- EPS (ttm)
- 10.37
- Shares out
- 1.06B
- P/E ratio
- 15.37
- Forward P/E
- 10.83
- Dividend
- 4.68 (2.76%)
- Ex-dividend date
- Nov 24, 2026
- YTD return
- -21.52%
- 1-year return
- -22.76%
- Volume
- 2.65M
- Avg volume
- 5.42M
- Open
- 157.50
- Previous close
- 154.41
- Day's range
- 156.06 – 161.80
- 52-week range
- 143.75 – 224.75
- Beta
- 0.38
- Analysts
- Buy
- Price target
- 225.64 (+41.6%)
- Earnings date
- Feb 10, 2027
1Y -45.09 (-22.02%)
Key statistics
- Enterprise value
- 283.01B
- PEG ratio
- 0.48
- Price / sales
- 1.74
- Price / book
- 2.91
- Dividend yield
- 2.92%
- Payout ratio
- 39.34%
- Revenue growth
- 7.40%
- Free cash flow
- 16.36B
- Total cash
- 5.62B
- Total debt
- 118.99B
- Return on equity
- 19.35%
- Short % of float
- 3.21%
- 50-day average
- 166.67
- 200-day average
- 186.81
Analyst view
Consensus: buy
- Target (low)
- 165.00
- Target (mean)
- 225.64
- Target (high)
- 296.00
- Strong buy9
- Buy15
- Hold4
- Sell0
- Strong sell0
Next earnings
Feb 10, 2027
Expected Feb 10, 2027. Consensus EPS estimate 2.59.
Financials — quick view
Earnings
| Report date | Quarter ending | EPS estimate | EPS reported | Surprise | Surprise % |
|---|---|---|---|---|---|
| Feb 10, 2027 | Dec 30, 2026 | 2.68 | — | — | — |
| Oct 28, 2026 | Sep 30, 2026 | 2.89 | 3.22 | +0.33 | +11.42% |
| Jul 23, 2026 | Jun 30, 2026 | 2.59 | 2.99 | +0.40 | +15.44% |
| Apr 28, 2026 | Mar 31, 2026 | 2.01 | 2.27 | +0.26 | +12.94% |
| Feb 11, 2026 | Dec 31, 2025 | 2.05 | 1.88 | -0.17 | -8.29% |
| Oct 23, 2025 | Sep 30, 2025 | 2.40 | 2.59 | +0.19 | +7.92% |
Upgrades / downgrades
| Date | Firm | Action | From | To |
|---|---|---|---|---|
| Oct 29, 2026 | JP Morgan | main | Overweight | Overweight |
| Oct 29, 2026 | Citigroup | main | Neutral | Neutral |
| Oct 29, 2026 | TD Cowen | main | Buy | Buy |
| Oct 29, 2026 | Scotiabank | main | Sector Outperform | Sector Outperform |
| Oct 29, 2026 | StoneX | reit | Buy | Buy |
| Oct 29, 2026 | Keybanc | main | Overweight | Overweight |
About T-Mobile US, Inc.
T-Mobile US, Inc., together with its subsidiaries, provides wireless communications services in the United States, Puerto Rico, and the United States Virgin Islands. The company offers voice, messaging, and data services to postpaid, prepaid, and wholesale and other services customers. It also provides wireless devices, including smartphones, wearables, tablets, home broadband gateways, headsets, and other mobile communication devices, as well as accessories; financing through equipment installment plans; reinsurance for device insurance policies and extended warranty contracts. The company offers services under the T-Mobile, Metro by T-Mobile, and Mint Mobile brands through its owned and operated retail stores, customer care channels, national retailers, and its websites, as well as through T-Mobile, Metro by T-Mobile, and Mint Mobile apps. It also sells devices to dealers and other third-party distributors for resale through independent third-party retail outlets and various third-party websites. It has 700 MHz wireless spectrum licenses. The company was founded in 1994 and is headquartered in Bellevue, Washington. T-Mobile US, Inc. operates as a subsidiary of Deutsche Telekom AG.
- Sector
- Communication Services
- Industry
- Telecom Services
- Country
- United States
- Website
- t-mobile.com
News
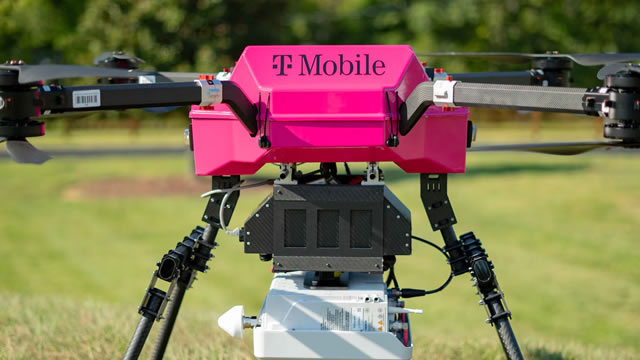 Can T-Mobile's Latest Fiber Plans Attract More Broadband Customers?
 Amdocs Stock Has Its Worst Day in 24 Years as T-Mobile Business Is at Risk
 Qualcomm Shares Rise Wednesday: What's Going On?
 Qualcomm Shares Rise Wednesday: What's Going On?
 Amdocs CEO Refuses to Detail T-Mobile Revenue Exposure As Dispute Rocks Outlook
 T-Mobile US, Inc. $TMUS Shares Sold by Aware Super Pty Ltd as trustee of Aware Super
 42,138 Shares in T-Mobile US, Inc. $TMUS Bought by Associated Banc Corp
 'U.S. Senate Commerce Committee To Hold Nov. 10 Confirmation Hearing For Federal Communications Commissioner Nominee Thumann' - Reuters News
 4 GARP Stocks to Buy Now as Volatility Fuels Value vs. Growth Debate
 T-Mobile Brings More to the Holiday Mix: Deals on the Season's Must-Have Tech, All-New T-Mix Plans and More
Your note
Sign in to keep a note on TMUS — it syncs with the Stock Master app.
Insider holders
| Insider | Relation | Latest transaction | Date | Shares held |
|---|---|---|---|---|
| CANO NESTOR | Chief Technology Officer | Stock Award(Grant) | Mar 31, 2025 | 185,221 |
| CLAURE RAUL MARCELO | Director | Stock Award(Grant) | Jun 15, 2026 | 2,741,000 |
| DEUTSCHE TELEKOM AG | Beneficial Owner of more than 10% of a Class of Security | Sale | Oct 28, 2025 | 0 |
| EWALDSSON ULF | Officer | Stock Award(Grant) | Mar 31, 2025 | 67,026 |
| FIELD CALLIE R | Officer | Sale | Jul 28, 2025 | 110,891 |
| FREIER JON | Chief Operating Officer | Sale | May 20, 2026 | 217,168 |
Institution ownership
| Holder | % held | Shares | Value | Reported |
|---|---|---|---|---|
| Blackrock Inc. | 3.73% | 39,499,642 | 6.10B | Jun 29, 2026 |
| Invesco Ltd. | 3.01% | 31,883,463 | 4.92B | Jun 29, 2026 |
| Vanguard Capital Management LLC | 2.77% | 29,359,860 | 4.53B | Jun 29, 2026 |
| Price (T.Rowe) Associates Inc | 2.41% | 25,481,834 | 3.93B | Jun 29, 2026 |
| State Street Corporation | 2.36% | 25,021,478 | 3.86B | Jun 29, 2026 |
| Morgan Stanley | 1.37% | 14,522,141 | 2.24B | Jun 29, 2026 |
Fund ownership
| Holder | % held | Shares | Value | Reported |
|---|---|---|---|---|
| Invesco QQQ Trust, Series 1 | 2.12% | 22,405,530 | 3.46B | Sep 29, 2026 |
| VANGUARD INDEX FUNDS-Vanguard Total Stock Market Index Fund | 1.30% | 13,743,553 | 2.12B | Jun 29, 2026 |
| VANGUARD INDEX FUNDS-Vanguard 500 Index Fund | 1.14% | 12,056,345 | 1.86B | Jun 29, 2026 |
| iShares Trust-iShares Core S&P 500 ETF | 0.61% | 6,432,063 | 993.17M | Sep 29, 2026 |
| Fidelity Concord Street Trust-Fidelity 500 Index Fund | 0.57% | 6,040,639 | 932.74M | Aug 30, 2026 |
| SPDR S&P 500 ETF TRUST-State Street SPDR S&P 500 ETF Trust | 0.56% | 5,972,204 | 922.17M | Sep 29, 2026 |