

The Southern Company SO
Nov 5, 2026, 1:26 PM EST
- YTD
- +8.50%
- 1 year
- +3.51%
- Market cap
- 108.82B
- Revenue (ttm)
- 30.18B
- Profit margin
- 15.43%
- EPS (ttm)
- 4.15
- Shares out
- 1.15B
- P/E ratio
- 22.79
- Forward P/E
- 18.94
- Dividend
- 3.04 (3.21%)
- Ex-dividend date
- Nov 15, 2026
- YTD return
- +8.50%
- 1-year return
- +3.51%
- Volume
- 6.27M
- Avg volume
- 6.06M
- Open
- 94.24
- Previous close
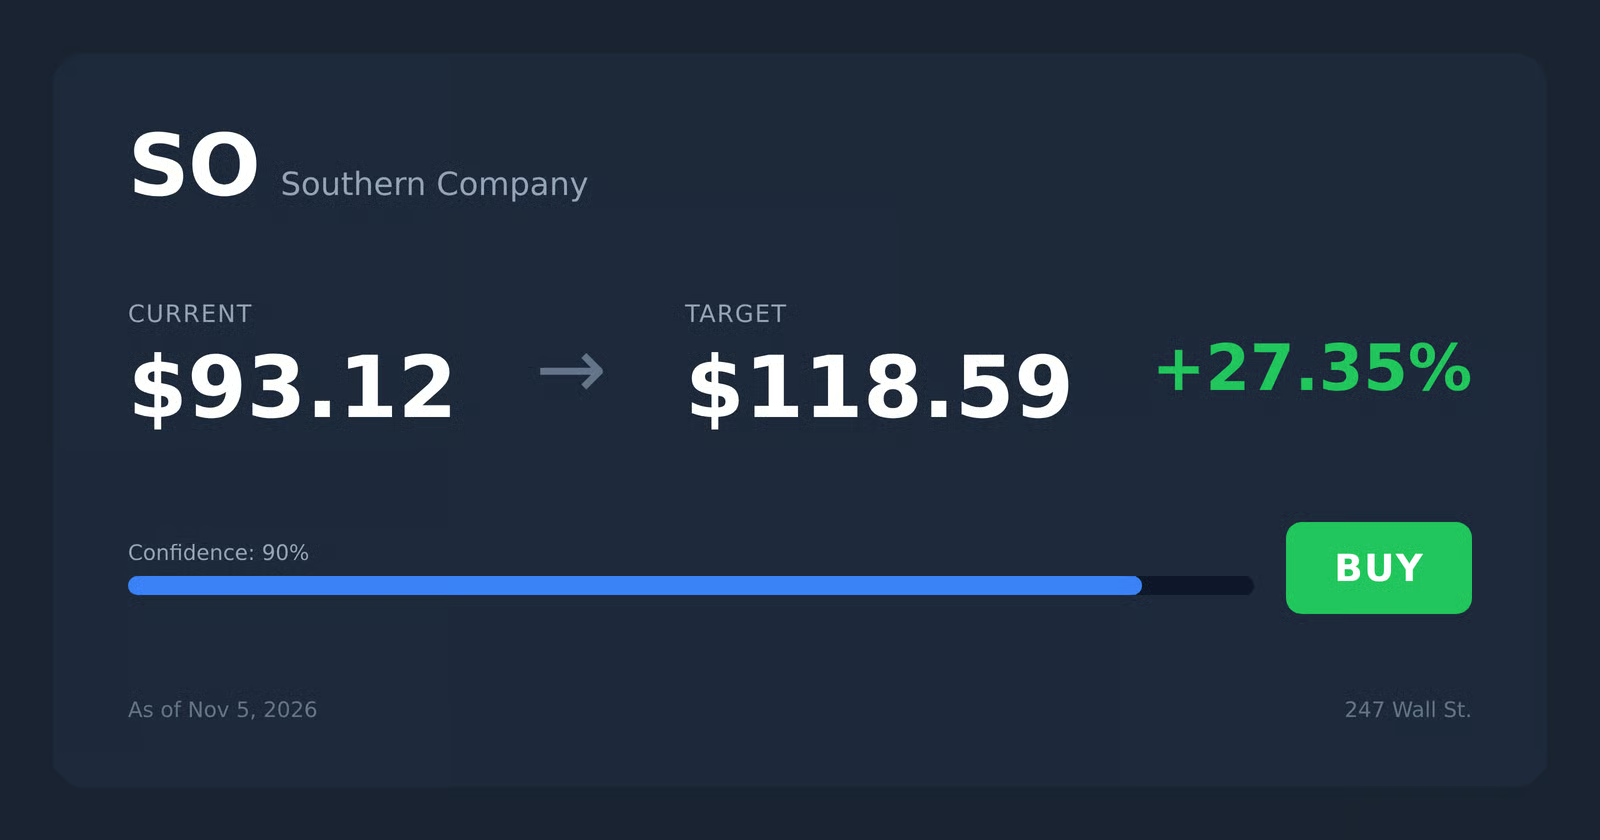
- 93.12
- Day's range
- 93.53 – 95.72
- 52-week range
- 82.35 – 99.11
- Beta
- 0.29
- Analysts
- Hold
- Price target
- 95.90 (+1.4%)
- Earnings date
- Nov 5, 2026
2Y +5.83 (+6.57%)
Key statistics
- Enterprise value
- 184.72B
- PEG ratio
- 2.22
- Price / sales
- 3.55
- Price / book
- 2.71
- Dividend yield
- 3.24%
- Payout ratio
- 71.81%
- Revenue growth
- 0.10%
- Free cash flow
- -3.91B
- Total cash
- 2.98B
- Total debt
- 77.09B
- Return on equity
- 11.48%
- Short % of float
- 2.56%
- 50-day average
- 87.97
- 200-day average
- 92.49
Analyst view
Consensus: hold
- Target (low)
- 74.00
- Target (mean)
- 95.90
- Target (high)
- 112.00
- Strong buy1
- Buy7
- Hold12
- Sell2
- Strong sell1
Next earnings
Nov 5, 2026
Expected Nov 5, 2026. Consensus EPS estimate 1.71.
Financials — quick view
Earnings
| Report date | Quarter ending | EPS estimate | EPS reported | Surprise | Surprise % |
|---|---|---|---|---|---|
| Nov 5, 2026 | Sep 30, 2026 | 1.71 | — | — | — |
| Jul 30, 2026 | Jun 30, 2026 | 1.01 | 1.13 | +0.12 | +11.88% |
| Apr 30, 2026 | Mar 31, 2026 | 1.21 | 1.32 | +0.11 | +9.09% |
| Feb 19, 2026 | Dec 31, 2025 | 0.558 | 0.55 | -0.01 | -1.43% |
| Oct 30, 2025 | Sep 30, 2025 | 1.51 | 1.60 | +0.09 | +5.96% |
| Jul 31, 2025 | Jun 30, 2025 | 0.875 | 0.91 | +0.04 | +4.00% |
Upgrades / downgrades
| Date | Firm | Action | From | To |
|---|---|---|---|---|
| Oct 22, 2026 | HSBC | init | — | Buy |
| Oct 21, 2026 | Morgan Stanley | main | Underweight | Underweight |
| Oct 20, 2026 | Jefferies | main | Hold | Hold |
| Oct 16, 2026 | Barclays | main | Equal-Weight | Equal-Weight |
| Oct 15, 2026 | Truist Securities | main | Hold | Hold |
| Oct 13, 2026 | JP Morgan | main | Neutral | Neutral |
About The Southern Company
The Southern Company, through its subsidiaries, engages in the sale of electricity. The company offers electric service to retail customers and wholesale customers; and energy-related products and services to natural gas choice markets. It also develops, constructs, acquires, owns, operates, and manages power generation assets, as well as battery energy storage projects; sells electricity at market-based rates in the wholesale market; and deploys microgrids for commercial, industrial, governmental, and utility customers. In addition, the company is involved in the distribution of natural gas in Illinois, Georgia, Virginia, and Tennessee; distributes energy and resilience solutions; and invests in telecommunications. The Southern Company was incorporated in 1945 and is headquartered in Atlanta, Georgia.
- Sector
- Utilities
- Industry
- Utilities - Regulated Electric
- Country
- United States
- Website
- southerncompany.com
News
 Defensives Lead Sectors Thursday As Growth Sectors Trail
 Southern Co. (SO) Q3 Earnings and Revenues Surpass Estimates
 Here's What Key Metrics Tell Us About Southern Co. (SO) Q3 Earnings
 Treasury Yields Are Falling. These 3 Dividend Stocks Could Be Big Winners
 Southern Q3 Adj. EPS $1.94 Beats $1.71 Estimate, Sales $8.843B Beat $8.359B Estimate
 Southern Company reports third-quarter 2026 earnings
 Toyota, ConocoPhillips On Deck Thursday As Auto Demand, Oil Prices Face Test
 8 Of 11 Sectors Rise Wednesday As Growth Leads
 4 Utility Stocks Set to Outperform Q3 Earnings Estimates This Season
 Associated Banc Corp Purchases New Position in Southern Company (The) $SO
Your note
Sign in to keep a note on SO — it syncs with the Stock Master app.
Institution ownership
| Holder | % held | Shares | Value | Reported |
|---|---|---|---|---|
| Blackrock Inc. | 8.08% | 92,990,716 | 8.66B | Jun 29, 2026 |
| Vanguard Capital Management LLC | 6.40% | 73,665,124 | 6.86B | Jun 29, 2026 |
| State Street Corporation | 5.63% | 64,809,708 | 6.04B | Jun 29, 2026 |
| Capital World Investors | 5.43% | 62,518,698 | 5.82B | Jun 29, 2026 |
| Price (T.Rowe) Associates Inc | 4.03% | 46,415,904 | 4.32B | Jun 29, 2026 |
| JPMORGAN CHASE & CO | 2.85% | 32,778,201 | 3.05B | Jun 29, 2026 |
Fund ownership
| Holder | % held | Shares | Value | Reported |
|---|---|---|---|---|
| VANGUARD INDEX FUNDS-Vanguard Total Stock Market Index Fund | 3.11% | 35,818,373 | 3.34B | Jun 29, 2026 |
| VANGUARD INDEX FUNDS-Vanguard 500 Index Fund | 2.54% | 29,223,029 | 2.72B | Jun 29, 2026 |
| SELECT SECTOR SPDR TRUST-State Street Utilities Select Sector SPDR ETF | 1.77% | 20,357,048 | 1.90B | Sep 29, 2026 |
| Income Fund of America | 1.63% | 18,795,587 | 1.75B | Sep 29, 2026 |
| iShares Trust-iShares Core S&P 500 ETF | 1.33% | 15,328,465 | 1.43B | Sep 29, 2026 |
| Fidelity Concord Street Trust-Fidelity 500 Index Fund | 1.30% | 14,950,112 | 1.39B | Sep 29, 2026 |