

Pembina Pipeline Corporation PBA
Regular-session close
After hours · Nov 20, 6:24 PM ET
- YTD
- +26.51%
- 1 year
- +24.87%
5D -1.30 (-2.58%)
- Market cap
- 28.00B
- Revenue (ttm)
- 8.35B
- Profit margin
- 24.78%
- EPS (ttm)
- 2.40
- Shares out
- 581.59M
- P/E ratio
- 20.06
- Forward P/E
- 21.22
- Dividend
- 2.05 (4.21%)
- Ex-dividend date
- Dec 15, 2026
- YTD return
- +26.51%
- 1-year return
- +24.87%
- Volume
- 1.42M
- Avg volume
- 1.04M
- Open
- 48.75
- Previous close
- 48.69
- Day's range
- 48.01 – 49.44
- 52-week range
- 36.52 – 51.37
- Beta
- 0.73
- Analysts
- Buy
- Price target
- 48.17 (+0.0%)
- Earnings date
- Feb 25, 2027
- 50-day average
- 48.16
Key statistics
- 200-day average
- 47.03
- Enterprise value
- 43.49B
- PEG ratio
- 1.73
- Price / sales
- 3.35
- Price / book
- 2.54
- Payout ratio
- 86.79%
- Revenue growth
- 21.70%
- Free cash flow
- 1.55B
- Total cash
- 252.00M
- Total debt
- 13.70B
- Return on equity
- 12.10%
Fundamental scorecard
15 of 25 checks passed on PBA’s reported financials
15of 25 checks passed
- Value 1 of 5
- Growth 4 of 5
- Profitability 4 of 5
- Financial health 2 of 5
- Dividend 4 of 5
Statements to Sep 30, 2026.
Analyst view
Consensus: buy
- Target (low)
- 46.17
- Target (mean)
- 48.17
- Target (high)
- 50.17
- Strong buy6
- Buy5
- Hold8
- Sell0
- Strong sell0
Next earnings
Feb 25, 2027
Expected Feb 25, 2027. Consensus EPS estimate 0.87184.
Financials — quick view
Earnings
| Report date | Quarter ending | EPS estimate | EPS reported | Surprise | Surprise % |
|---|---|---|---|---|---|
| Feb 25, 2027 | Dec 30, 2026 | 0.57 | — | — | — |
| Nov 5, 2026 | Sep 30, 2026 | 0.38 | 0.55 | +0.17 | +44.74% |
| Jul 30, 2026 | Jun 30, 2026 | 0.49 | 0.48 | -0.01 | -2.04% |
| May 7, 2026 | Mar 31, 2026 | 0.52 | 0.59 | +0.07 | +13.46% |
| Feb 26, 2026 | Dec 31, 2025 | 0.50 | 0.56 | +0.06 | +12.00% |
| Nov 6, 2025 | Sep 30, 2025 | 0.45 | 0.31 | -0.14 | -31.11% |
Upgrades / downgrades
| Date | Firm | Action | From | To |
|---|---|---|---|---|
| May 11, 2026 | RBC Capital | main | Outperform | Outperform |
| Mar 19, 2026 | JP Morgan | main | Neutral | Neutral |
| Dec 16, 2025 | TD Securities | main | Buy | Buy |
| Aug 28, 2024 | Citigroup | main | Neutral | Neutral |
| Jul 3, 2024 | CIBC | main | Outperformer | Outperformer |
| Apr 19, 2024 | CIBC | main | Outperformer | Outperformer |
About Pembina Pipeline Corporation
Pembina Pipeline Corporation provides energy transportation and midstream services. It operates through three segments: Pipelines, Facilities, and Marketing & New Ventures. The Pipelines segment operates conventional, oil sands and heavy oil, and transmission assets with a transportation capacity of 3.0 million of barrels of oil equivalent per day, and the ground storage capacity of 10 million of barrels serving markets and basins across North America. The Facilities segment offers infrastructure that provides customers with crude oil, natural gas, condensate, and natural gas liquids (NGLs), including ethane, propane, butane, and condensate; and includes 430 thousands of barrels of NGL fractionation capacity, 21 million of barrels of cavern storage capacity, and various oil batteries, associated pipeline, and rail terminalling facilities and a liquefied propane export facility. The Marketing & New Ventures segment buys and sells hydrocarbon liquids and natural gas originating in the Western Canadian sedimentary basin and other basins. Pembina Pipeline Corporation was incorporated in 1954 and is headquartered in Calgary, Canada.
- Sector
- Energy
- Industry
- Oil & Gas Midstream
- Country
- Canada
- Website
- pembina.com
News
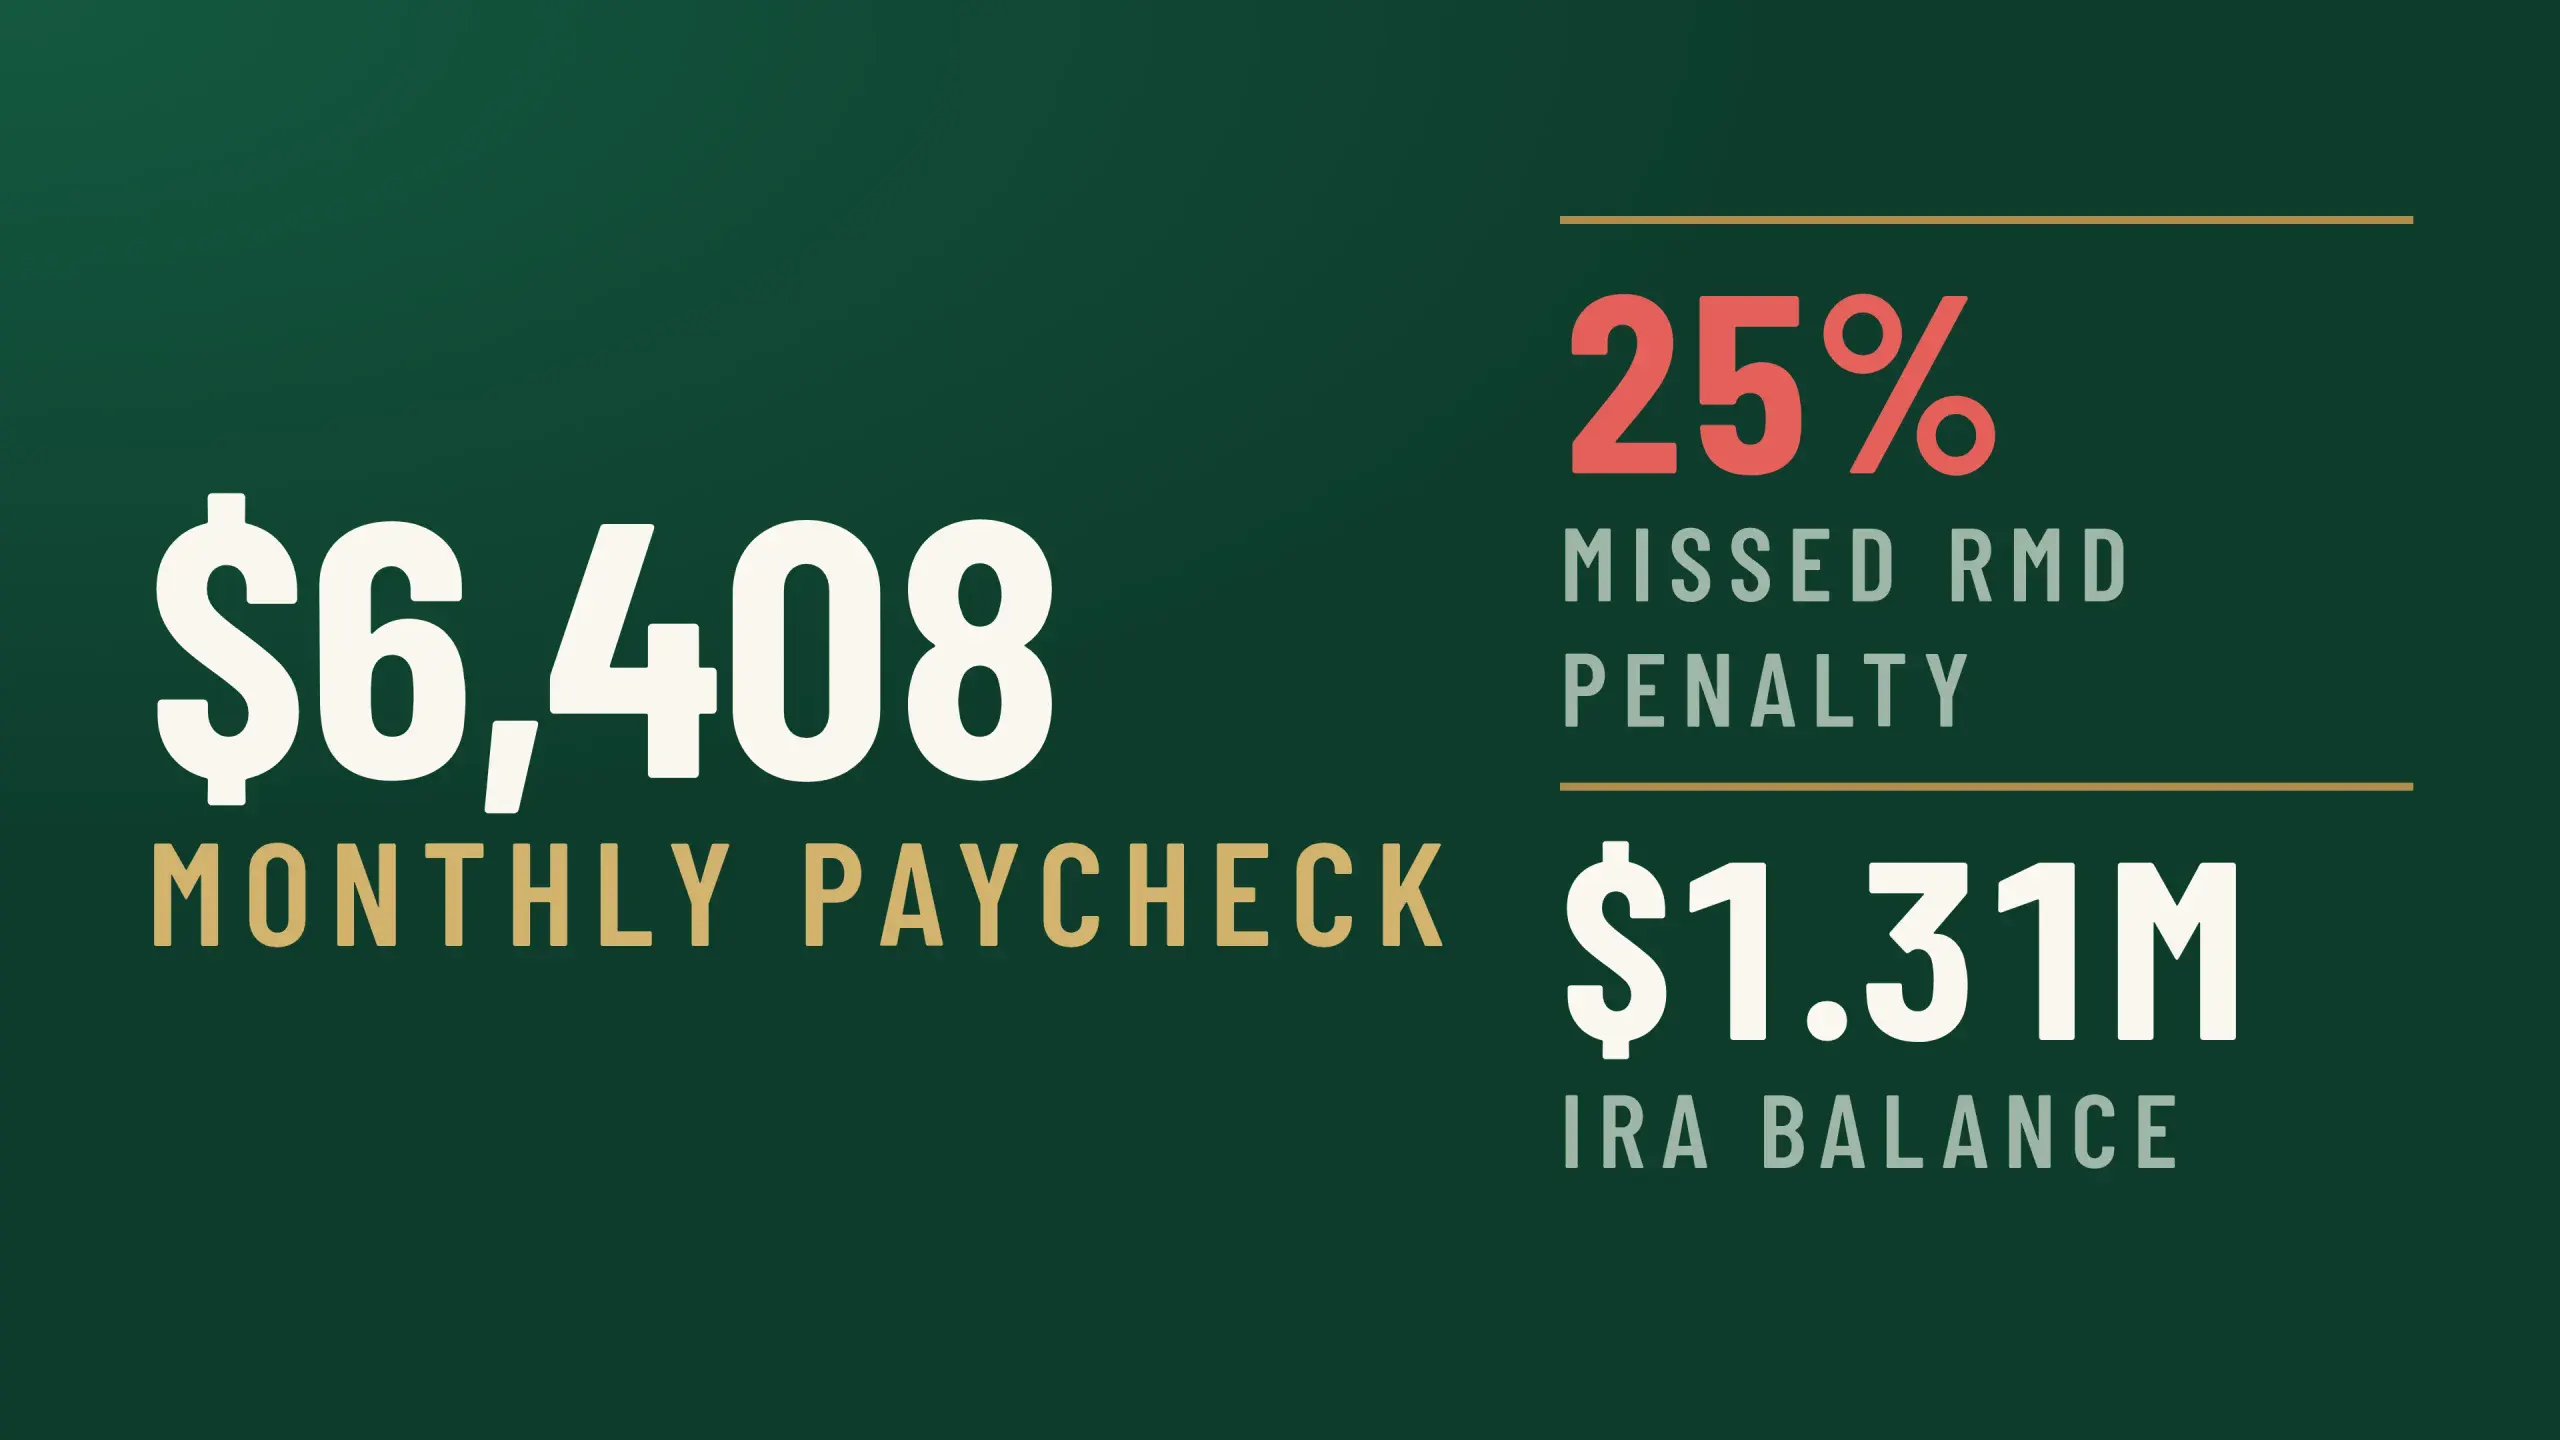 The RMD Mistake That Turns a $1.31 Million IRA’s $6,408 Monthly Paycheck Into a Bigger Tax Bill
 Pembina Pipeline Eyes Growth as Canadian Energy Demand Expands
 Pembina Pipeline Q3 Adj. EPS $0.55 Beats $0.38 Estimate, Sales $1.557B Beat $966.720M Estimate
 Toyota, ConocoPhillips On Deck Thursday As Auto Demand, Oil Prices Face Test
 CIBC Downgrades Pembina Pipeline to Neutral, Lowers Price Target to C$71
Your note
Sign in to keep a note on PBA — it syncs with the Stock Master app.
Insider holders
| Insider | Relation | Latest transaction | Date | Shares held |
|---|---|---|---|---|
| Ainsworth (Anne Marie) | Director of Issuer | Acquisition or disposition under a purchase/ownership plan | Dec 30, 2025 | 27,924 |
| Balfour (Carl Ian) | Senior Officer of Issuer | Opening Balance-Initial SEDI Report | Dec 31, 2025 | 0 |
| Burrows, J Scott | Senior Officer of Issuer | Exercise of options | Aug 10, 2026 | 43,931 |
| Goldade (Cameron) | Senior Officer of Issuer | Exercise of options | Aug 25, 2026 | 11,460 |
| Lee-Essington (Carmen) | Senior Officer of Issuer | Opening Balance-Initial SEDI Report | Dec 31, 2025 | 0 |
| Rousch, Christopher Wayne | Senior Officer of Issuer | Opening Balance-Initial SEDI Report | Dec 31, 2025 | 0 |
Institution ownership
| Holder | % held | Shares | Value | Reported |
|---|---|---|---|---|
| Royal Bank of Canada | 8.22% | 47,810,896 | 2.30B | Sep 29, 2026 |
| Bank of Montreal /CAN/ | 3.82% | 22,220,185 | 1.07B | Sep 29, 2026 |
| Vanguard Capital Management LLC | 2.90% | 16,892,533 | 813.21M | Sep 29, 2026 |
| ClearBridge Investments, LLC | 2.23% | 12,941,319 | 623.00M | Sep 29, 2026 |
| CIBC World Market, Inc. | 1.74% | 10,145,153 | 488.39M | Sep 29, 2026 |
| 1832 Asset Management L.P. | 1.69% | 9,822,952 | 472.88M | Sep 29, 2026 |
Fund ownership
| Holder | % held | Shares | Value | Reported |
|---|---|---|---|---|
| VANGUARD STAR FUNDS-Vanguard Total International Stock Index Fund | 1.47% | 8,545,740 | 411.39M | Jul 30, 2026 |
| VANGUARD TAX-MANAGED FUNDS-Vanguard Developed Markets Index Fund | 0.98% | 5,685,376 | 273.69M | Jun 29, 2026 |
| Tortoise Capital Series TRT-Tortoise Energy Infrastructure Total Retur | 0.61% | 3,554,062 | 171.09M | Sep 29, 2026 |
| GLOBAL X FUNDS-Global X MLP & Energy Infrastructure ETF | 0.58% | 3,387,210 | 163.06M | Sep 29, 2026 |
| Fidelity Concord Street Trust-Fidelity SAI Canada Equity Index Fund | 0.58% | 3,379,461 | 162.69M | Sep 29, 2026 |
| iShares Trust-iShares Global Infrastructure ETF | 0.36% | 2,070,165 | 99.66M | Sep 29, 2026 |