

W.W. Grainger, Inc. GWW
Regular-session close
After hours · Nov 19, 4:00 PM ET
- YTD
- +41.11%
- 1 year
- +54.34%
5D -80.12 (-5.33%)
- Market cap
- 66.66B
- Revenue (ttm)
- 19.37B
- Profit margin
- 11.17%
- EPS (ttm)
- 45.51
- Shares out
- 46.81M
- P/E ratio
- 31.29
- Forward P/E
- 27.32
- Dividend
- 9.96 (0.69%)
- Ex-dividend date
- Nov 9, 2026
- YTD return
- +41.11%
- 1-year return
- +54.34%
- Volume
- 374.97K
- Avg volume
- 268.45K
- Open
- 1,446.28
- Previous close
- 1,448.12
- Day's range
- 1,412.88 – 1,451.99
- 52-week range
- 916.11 – 1,521.41
- Beta
- 0.95
- Analysts
- Hold
- Price target
- 1,461.79 (+2.7%)
- Earnings date
- Feb 2, 2027
- 50-day average
- 1,340.03
Key statistics
- 200-day average
- 1,261.67
- Enterprise value
- 70.49B
- PEG ratio
- 1.90
- Price / sales
- 3.44
- Price / book
- 15.39
- Payout ratio
- 20.87%
- Revenue growth
- 11.30%
- Free cash flow
- 1.33B
- Total cash
- 768.00M
- Total debt
- 3.07B
- Return on equity
- 52.33%
- Short % of float
- 3.08%
Fundamental scorecard
17 of 25 checks passed on GWW’s reported financials
17of 25 checks passed
- Value 0 of 5
- Growth 5 of 5
- Profitability 4 of 5
- Financial health 4 of 5
- Dividend 4 of 5
Statements to Sep 30, 2026.
Analyst view
Consensus: hold
- Target (low)
- 1,180.00
- Target (mean)
- 1,461.79
- Target (high)
- 1,645.00
- Strong buy0
- Buy3
- Hold14
- Sell0
- Strong sell2
Next earnings
Feb 2, 2027
Expected Feb 2, 2027. Consensus EPS estimate 11.50.
Financials — quick view
Earnings
| Report date | Quarter ending | EPS estimate | EPS reported | Surprise | Surprise % |
|---|---|---|---|---|---|
| Feb 2, 2027 | Dec 30, 2026 | 11.49 | — | — | — |
| Nov 4, 2026 | Sep 30, 2026 | 11.68 | 12.54 | +0.86 | +7.36% |
| Aug 4, 2026 | Jun 30, 2026 | 11.30 | 12.01 | +0.71 | +6.28% |
| May 7, 2026 | Mar 31, 2026 | 10.21 | 11.65 | +1.44 | +14.10% |
| Feb 3, 2026 | Dec 31, 2025 | 9.46 | 9.44 | -0.02 | -0.21% |
| Oct 31, 2025 | Sep 30, 2025 | 9.98 | 10.21 | +0.23 | +2.30% |
Upgrades / downgrades
| Date | Firm | Action | From | To |
|---|---|---|---|---|
| Nov 16, 2026 | Morgan Stanley | main | Equal-Weight | Equal-Weight |
| Nov 16, 2026 | Barclays | main | Underweight | Underweight |
| Nov 5, 2026 | RBC Capital | main | Sector Perform | Sector Perform |
| Nov 5, 2026 | Oppenheimer | main | Outperform | Outperform |
| Nov 5, 2026 | Stephens & Co. | main | Equal-Weight | Equal-Weight |
| Oct 14, 2026 | RBC Capital | main | Sector Perform | Sector Perform |
About W.W. Grainger, Inc.
W.W. Grainger, Inc., together with its subsidiaries, distributes maintenance, repair, and operating products and services primarily in North America, Japan, and the United Kingdom. The company operates through two segments, High-Touch Solutions North America and Endless Assortment. It provides safety, security, material handling and storage equipment, pumps and plumbing equipment, cleaning and maintenance, and metalworking and hand tools. The company also offers technical support and inventory management services. It serves smaller businesses to large corporations, government entities, and other institutions, as well as commercial, healthcare, and manufacturing industries through sales and service representatives, and electronic and ecommerce channels. W.W. Grainger, Inc. was founded in 1927 and is headquartered in Lake Forest, Illinois.
- Sector
- Industrials
- Industry
- Industrial Distribution
- Country
- United States
- Website
- grainger.com
News
 Top 3 Industrials Stocks That Are Ticking Portfolio Bombs
 Morgan Stanley Maintains Equal-Weight on W.W. Grainger, Raises Price Target to $1590
 Barclays Maintains Underweight on W.W. Grainger, Raises Price Target to $1355
 Top 50 High-Quality Dividend Growth Stocks For November 2026
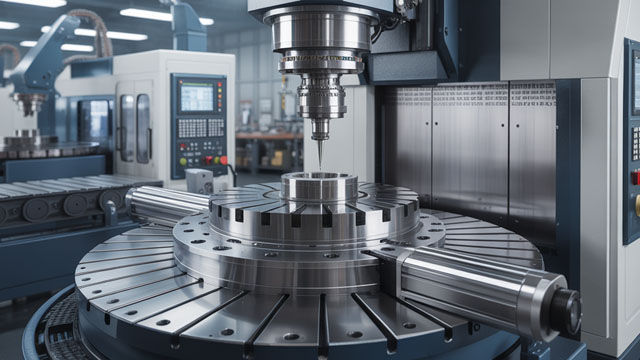 3 Boring Businesses That Keep Customers Coming Back and Profits Growing
 $1,000 Invested in W.W. Grainger 10 Years Ago Would Be Worth Nearly $7,900 Today
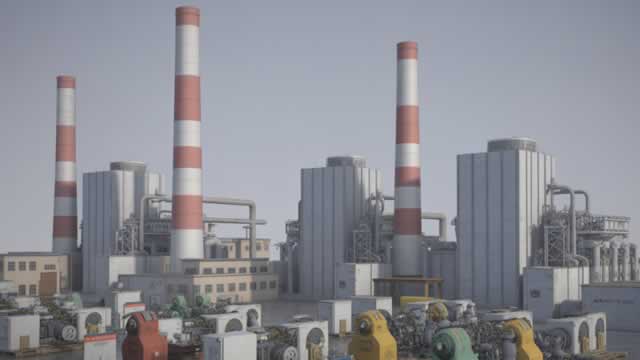 W.W. Grainger Q3 Earnings Call Highlights
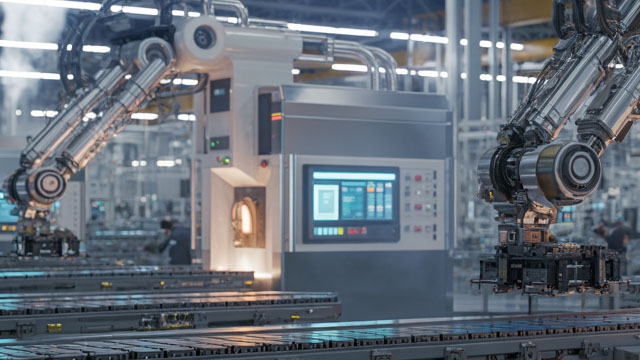 W.W. Grainger: AI Demand Adds Momentum, But Valuation Leaves Little Room For Error
 Here’s How Much You Would Have Made Owning W.W. Grainger Stock In The Last 10 Years
- RBC Capital Maintains Sector Perform on W.W. Grainger, Raises Price Target to $1582
Your note
Sign in to keep a note on GWW — it syncs with the Stock Master app.
Insider holders
| Insider | Relation | Latest transaction | Date | Shares held |
|---|---|---|---|---|
| BERARDINELLI KRANTZ NANCY L | Officer | Sale | Nov 16, 2026 | 3,591 |
| LEROY JONATHAN MICHAEL | Chief Technology Officer | Sale | Nov 15, 2026 | 1,454 |
| MACPHERSON DONALD G | Chief Executive Officer | Stock Gift | Nov 12, 2026 | 107,070 |
| MERRIWETHER DEIDRA C | Chief Financial Officer | Sale | Apr 1, 2026 | 10,541 |
| ROBBINS PAIGE K | Officer | Sale | May 11, 2026 | 18,236 |
| THOMSON LAURIE R. | Officer | Sale | May 11, 2026 | 399 |
Institution ownership
| Holder | % held | Shares | Value | Reported |
|---|---|---|---|---|
| Blackrock Inc. | 9.99% | 4,675,265 | 6.66B | Sep 29, 2026 |
| Vanguard Capital Management LLC | 6.15% | 2,880,007 | 4.10B | Sep 29, 2026 |
| Vanguard Portfolio Management LLC | 4.97% | 2,328,670 | 3.32B | Sep 29, 2026 |
| State Street Corporation | 4.28% | 2,001,645 | 2.85B | Sep 29, 2026 |
| Geode Capital Management, LLC | 2.99% | 1,400,581 | 2.00B | Sep 29, 2026 |
| Wells Fargo & Company | 1.57% | 736,925 | 1.05B | Sep 29, 2026 |
Fund ownership
| Holder | % held | Shares | Value | Reported |
|---|---|---|---|---|
| VANGUARD INDEX FUNDS-Vanguard Total Stock Market Index Fund | 3.04% | 1,423,707 | 2.03B | Jun 29, 2026 |
| VANGUARD INDEX FUNDS-Vanguard 500 Index Fund | 2.40% | 1,124,016 | 1.60B | Jun 29, 2026 |
| VANGUARD INDEX FUNDS-Vanguard Mid-Cap Index Fund | 2.08% | 971,933 | 1.38B | Jun 29, 2026 |
| iShares Trust-iShares Core S&P 500 ETF | 1.23% | 577,299 | 822.34M | Sep 29, 2026 |
| Fidelity Concord Street Trust-Fidelity 500 Index Fund | 1.20% | 563,153 | 802.19M | Sep 29, 2026 |
| SPDR S&P 500 ETF TRUST-State Street SPDR S&P 500 ETF Trust | 1.15% | 536,096 | 763.64M | Sep 29, 2026 |