

Carnival Corporation Ltd. CCL
At closeNov 12, 2026, 7:56 PM EST
After hours · Nov 12, 7:56 PM ET
- YTD
- -3.93%
- 1 year
- +8.15%
- Market cap
- 39.45B
- Revenue (ttm)
- 27.59B
- Profit margin
- 11.37%
- EPS (ttm)
- 2.27
- Shares out
- 1.34B
- P/E ratio
- 12.93
- Forward P/E
- 11.38
- Dividend
- 0.60 (1.95%)
- Ex-dividend date
- Nov 5, 2026
- YTD return
- -3.93%
- 1-year return
- +8.15%
- Volume
- 15.11M
- Avg volume
- 21.55M
- Open
- 30.34
- Previous close
- 30.68
- Day's range
- 29.29 – 30.34
- 52-week range
- 21.45 – 34.03
- Beta
- 2.46
- Analysts
- Buy
- Price target
- 33.56 (+14.4%)
- Earnings date
- Dec 18, 2026
5D +0.11 (+0.38%)
Key statistics
- Enterprise value
- 65.21B
- PEG ratio
- 1.05
- Price / sales
- 1.43
- Price / book
- 2.80
- Dividend yield
- 1.96%
- Payout ratio
- 19.82%
- Revenue growth
- 3.50%
- Free cash flow
- 1.81B
- Total cash
- 1.22B
- Total debt
- 25.16B
- Return on equity
- 24.00%
- Short % of float
- 3.25%
- 50-day average
- 25.69
- 200-day average
- 27.14
Analyst view
Consensus: buy
- Target (low)
- 23.00
- Target (mean)
- 33.56
- Target (high)
- 43.00
- Strong buy5
- Buy18
- Hold7
- Sell0
- Strong sell0
Next earnings
Dec 18, 2026
Expected Dec 18, 2026. Consensus EPS estimate 0.22394.
Financials — quick view
Earnings
| Report date | Quarter ending | EPS estimate | EPS reported | Surprise | Surprise % |
|---|---|---|---|---|---|
| Dec 18, 2026 | Nov 30, 2026 | 0.22 | — | — | — |
| Sep 29, 2026 | Aug 31, 2026 | 1.35 | 1.43 | +0.08 | +5.93% |
| Jun 23, 2026 | May 31, 2026 | 0.3442 | 0.41 | +0.07 | +19.12% |
| Mar 27, 2026 | Feb 28, 2026 | 0.1844 | 0.20 | +0.02 | +8.46% |
| Dec 19, 2025 | Nov 30, 2025 | 0.2481 | 0.34 | +0.09 | +37.04% |
| Sep 29, 2025 | Aug 31, 2025 | 1.32 | 1.43 | +0.11 | +8.33% |
Upgrades / downgrades
| Date | Firm | Action | From | To |
|---|---|---|---|---|
| Oct 13, 2026 | Tigress Financial | main | Buy | Buy |
| Oct 1, 2026 | Freedom Broker | main | Buy | Buy |
| Oct 1, 2026 | Argus Research | main | Buy | Buy |
| Oct 1, 2026 | Wells Fargo | main | Overweight | Overweight |
| Sep 30, 2026 | Morgan Stanley | main | Overweight | Overweight |
| Sep 30, 2026 | Susquehanna | main | Positive | Positive |
About Carnival Corporation Ltd.
Carnival Corporation Ltd., a cruise company, provides leisure travel services. The company operates through four segments: North America Cruise Operations, Europe Cruise Operations, Cruise Support, and Tour and Other. It operates port destinations and islands, as well as owns and operates hotels, lodges, glass-domed railcars, and motorcoaches. The company offers its services under the AIDA Cruises, Carnival Cruise Line, Costa Cruises, Cunard, Holland America Line, P&O Cruises (Australia), P&O Cruises (UK), Princess Cruises, and Seabourn brands. It sells its cruises through travel agents, tour operators, vacation planners, websites, and onboard future cruise consultants. Carnival Corporation Ltd. was founded in 1972 and is headquartered in Miami, Florida.
- Sector
- Consumer Cyclical
- Industry
- Travel Services
- Country
- United States
- Website
- carnivalcorp.com
News
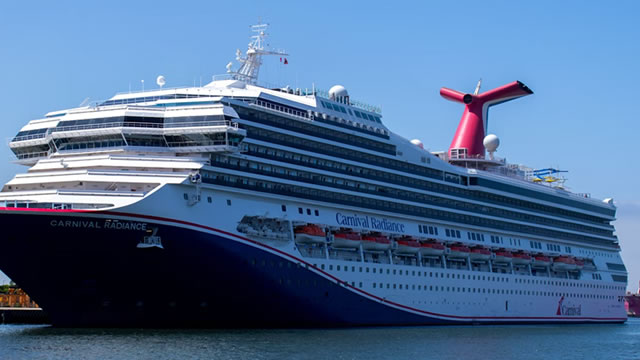 Here's Why Carnival (CCL) Fell More Than Broader Market
 SEABOURN BRINGS THE FLAVORS OF THE CARIBBEAN TO LIFE WITH NEW EARTH & OCEAN CULINARY EXPERIENCES
 Cunard Unveils First Look at Reimagined Queen Victoria Following Extensive Transformation
 CCL Stock Gains 16% in a Month: Should You Buy Now or Hold Steady?
 Cunard Reveals New Interiors of Queen Mary 2 with 'Cunard Deco'
 Holland America Line Gives Travelers Early Access to Exceptional Black Friday Savings
 Four Loyal Princess Cruises Guests Win the Experience to Ride 2027 Rose Parade® Float
 Cruise Lines Lean Into Premium 11/10/26
 Carnival Stocks Rise 3.55% as Oil Drop Eases a $2.25 Billion Fuel Bill
 6 Consumer Discretionary Stocks Whale Activity In Today’s Session
Your note
Sign in to keep a note on CCL — it syncs with the Stock Master app.
Institution ownership
| Holder | % held | Shares | Value | Reported |
|---|---|---|---|---|
| Blackrock Inc. | 7.16% | 96,304,948 | 2.83B | Jun 29, 2026 |
| Vanguard Capital Management LLC | 6.15% | 82,678,077 | 2.43B | Jun 29, 2026 |
| Vanguard Portfolio Management LLC | 4.64% | 62,406,507 | 1.83B | Jun 29, 2026 |
| State Street Corporation | 4.33% | 58,217,260 | 1.71B | Jun 29, 2026 |
| Causeway Capital Management LLC | 3.06% | 41,190,606 | 1.21B | Jun 29, 2026 |
| Geode Capital Management, LLC | 2.67% | 35,908,332 | 1.05B | Sep 29, 2026 |
Fund ownership
| Holder | % held | Shares | Value | Reported |
|---|---|---|---|---|
| VANGUARD INDEX FUNDS-Vanguard Total Stock Market Index Fund | 2.94% | 39,584,407 | 1.16B | Jun 29, 2026 |
| VANGUARD INDEX FUNDS-Vanguard 500 Index Fund | 2.48% | 33,336,576 | 978.26M | Jun 29, 2026 |
| VANGUARD INDEX FUNDS-Vanguard Mid-Cap Index Fund | 2.01% | 27,019,494 | 792.89M | Jun 29, 2026 |
| iShares Trust-iShares Core S&P 500 ETF | 1.26% | 16,972,419 | 498.06M | Sep 29, 2026 |
| Fidelity Concord Street Trust-Fidelity 500 Index Fund | 1.23% | 16,553,933 | 485.78M | Sep 29, 2026 |
| SPDR S&P 500 ETF TRUST-State Street SPDR S&P 500 ETF Trust | 1.17% | 15,759,538 | 462.46M | Sep 29, 2026 |