

VanEck BDC Income ETF BIZD
12.63 USD +0.23 (+1.86%)
Nov 4, 2026, 9:36 AM EST
12.52 Day range 12.65
11.73 52-week range 15.12
- YTD
- -10.93%
- 1 year
- -11.37%
- Market cap
- 1.47B
- EPS (ttm)
- 0.976933
- P/E ratio
- 12.94
- YTD return
- -10.93%
- 1-year return
- -11.37%
- Volume
- 97.59K
- Avg volume
- 2.74M
- Open
- 12.54
- Previous close
- 12.40
- Day's range
- 12.52 – 12.65
- 52-week range
- 11.73 – 15.12
MAX -7.88 (-38.55%)
Key statistics
- Enterprise value
- 0
- PEG ratio
- 0.00
- Price / sales
- 0.00
- Price / book
- 0.00
- Dividend yield
- 0.00%
- Payout ratio
- 0.00%
- Revenue growth
- 0.00%
- Free cash flow
- 0
- Total cash
- 0
- Total debt
- 0
- Return on equity
- 0.00%
- Short % of float
- 0.00%
- 50-day average
- 12.69
- 200-day average
- 12.85
Next earnings
Consensus EPS estimate 0.00.
About VanEck BDC Income ETF
The fund normally invests at least 80% of its total assets in securities that comprise the fund’s benchmark index and/or in investments or instruments that have investment exposure to securities that comprise its benchmark index. The BDC index is comprised of BDCs.
News
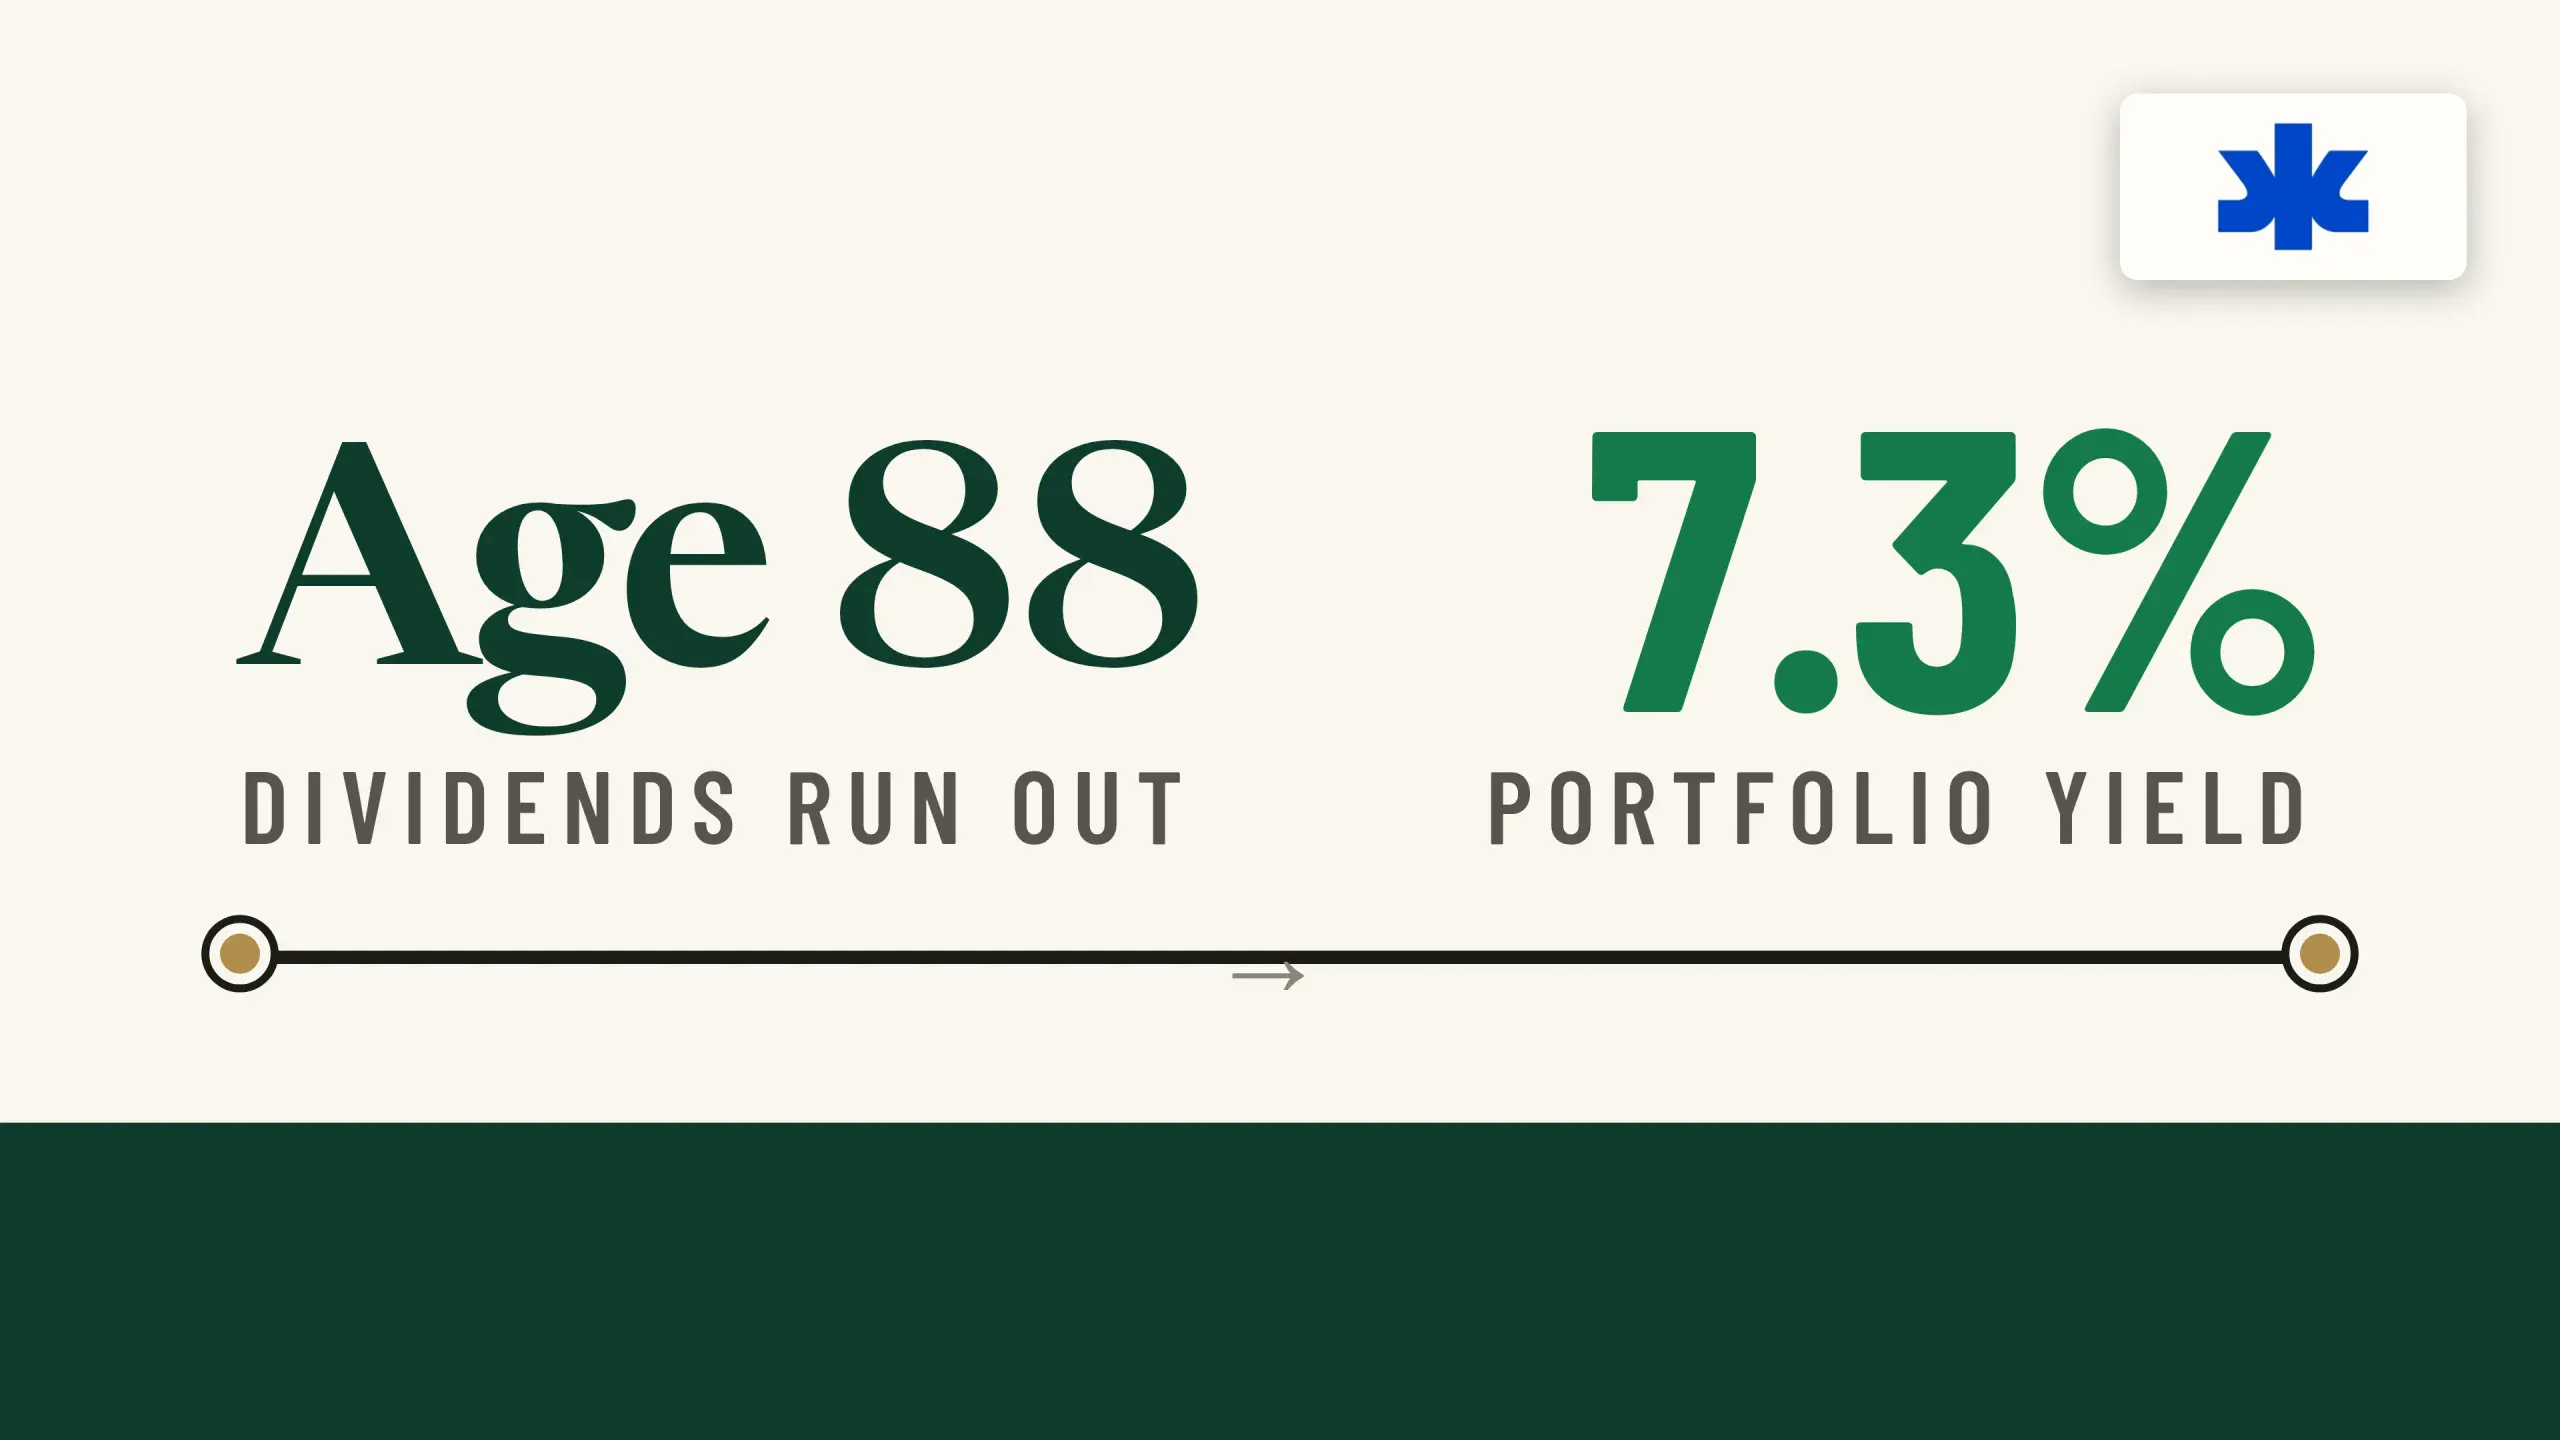 The Dividend Portfolio That Covers Your Required Minimum Distribution Without Selling a Share: KMB, BIZD, and SPHD
 Dividend Investing: Why This Dip Is A Gift
 Building A 7%-Yielding Dividend Growth Portfolio With SCHD As Its Core Holding
 2 Retirement Income Anchors Worth Buying On The Dip
 Why I'm Capping My BDC Exposure At 15%
 The More They Drop, The More I Buy: 11%+ Yields With Massive Upside
 2 BDCs For Bargain Hunters
 5 BDCs Priced For Loan Losses Worse Than 2008, Heading Into Q3
 Dividend Growth Is Broken In A 5% World - 2 Picks To Fix It
 2 BDCs To Buy That Could Replace ARCC And OBDC In Your Portfolio
Your note
Sign in to keep a note on BIZD — it syncs with the Stock Master app.