

VanEck BDC Income ETF BIZD
12.65 USD +0.12 (+0.96%)
At closeNov 9, 2026, 4:00 PM EST
12.66 +0.01 +0.08%
After hours · Nov 9, 4:00 PM ET
12.49 Day range 12.71
11.73 52-week range 15.12
- YTD
- -10.79%
- 1 year
- -10.85%
- Market cap
- 1.49B
- EPS (ttm)
- 0.922931
- P/E ratio
- 13.71
- YTD return
- -10.79%
- 1-year return
- -10.85%
- Volume
- 2.38M
- Avg volume
- 2.69M
- Open
- 12.62
- Previous close
- 12.53
- Day's range
- 12.49 – 12.71
- 52-week range
- 11.73 – 15.12
1M +0.55 (+4.55%)
Key statistics
- Enterprise value
- 0
- PEG ratio
- 0.00
- Price / sales
- 0.00
- Price / book
- 0.00
- Dividend yield
- 0.00%
- Payout ratio
- 0.00%
- Revenue growth
- 0.00%
- Free cash flow
- 0
- Total cash
- 0
- Total debt
- 0
- Return on equity
- 0.00%
- Short % of float
- 0.00%
- 50-day average
- 12.62
- 200-day average
- 12.81
Next earnings
Consensus EPS estimate 0.00.
About VanEck BDC Income ETF
The fund normally invests at least 80% of its total assets in securities that comprise the fund’s benchmark index and/or in investments or instruments that have investment exposure to securities that comprise its benchmark index. The BDC index is comprised of BDCs.
News
 BIZD's 9.69% Expense Ratio Includes Fees Its BDCs Charge Before the Fund Takes Its Cut
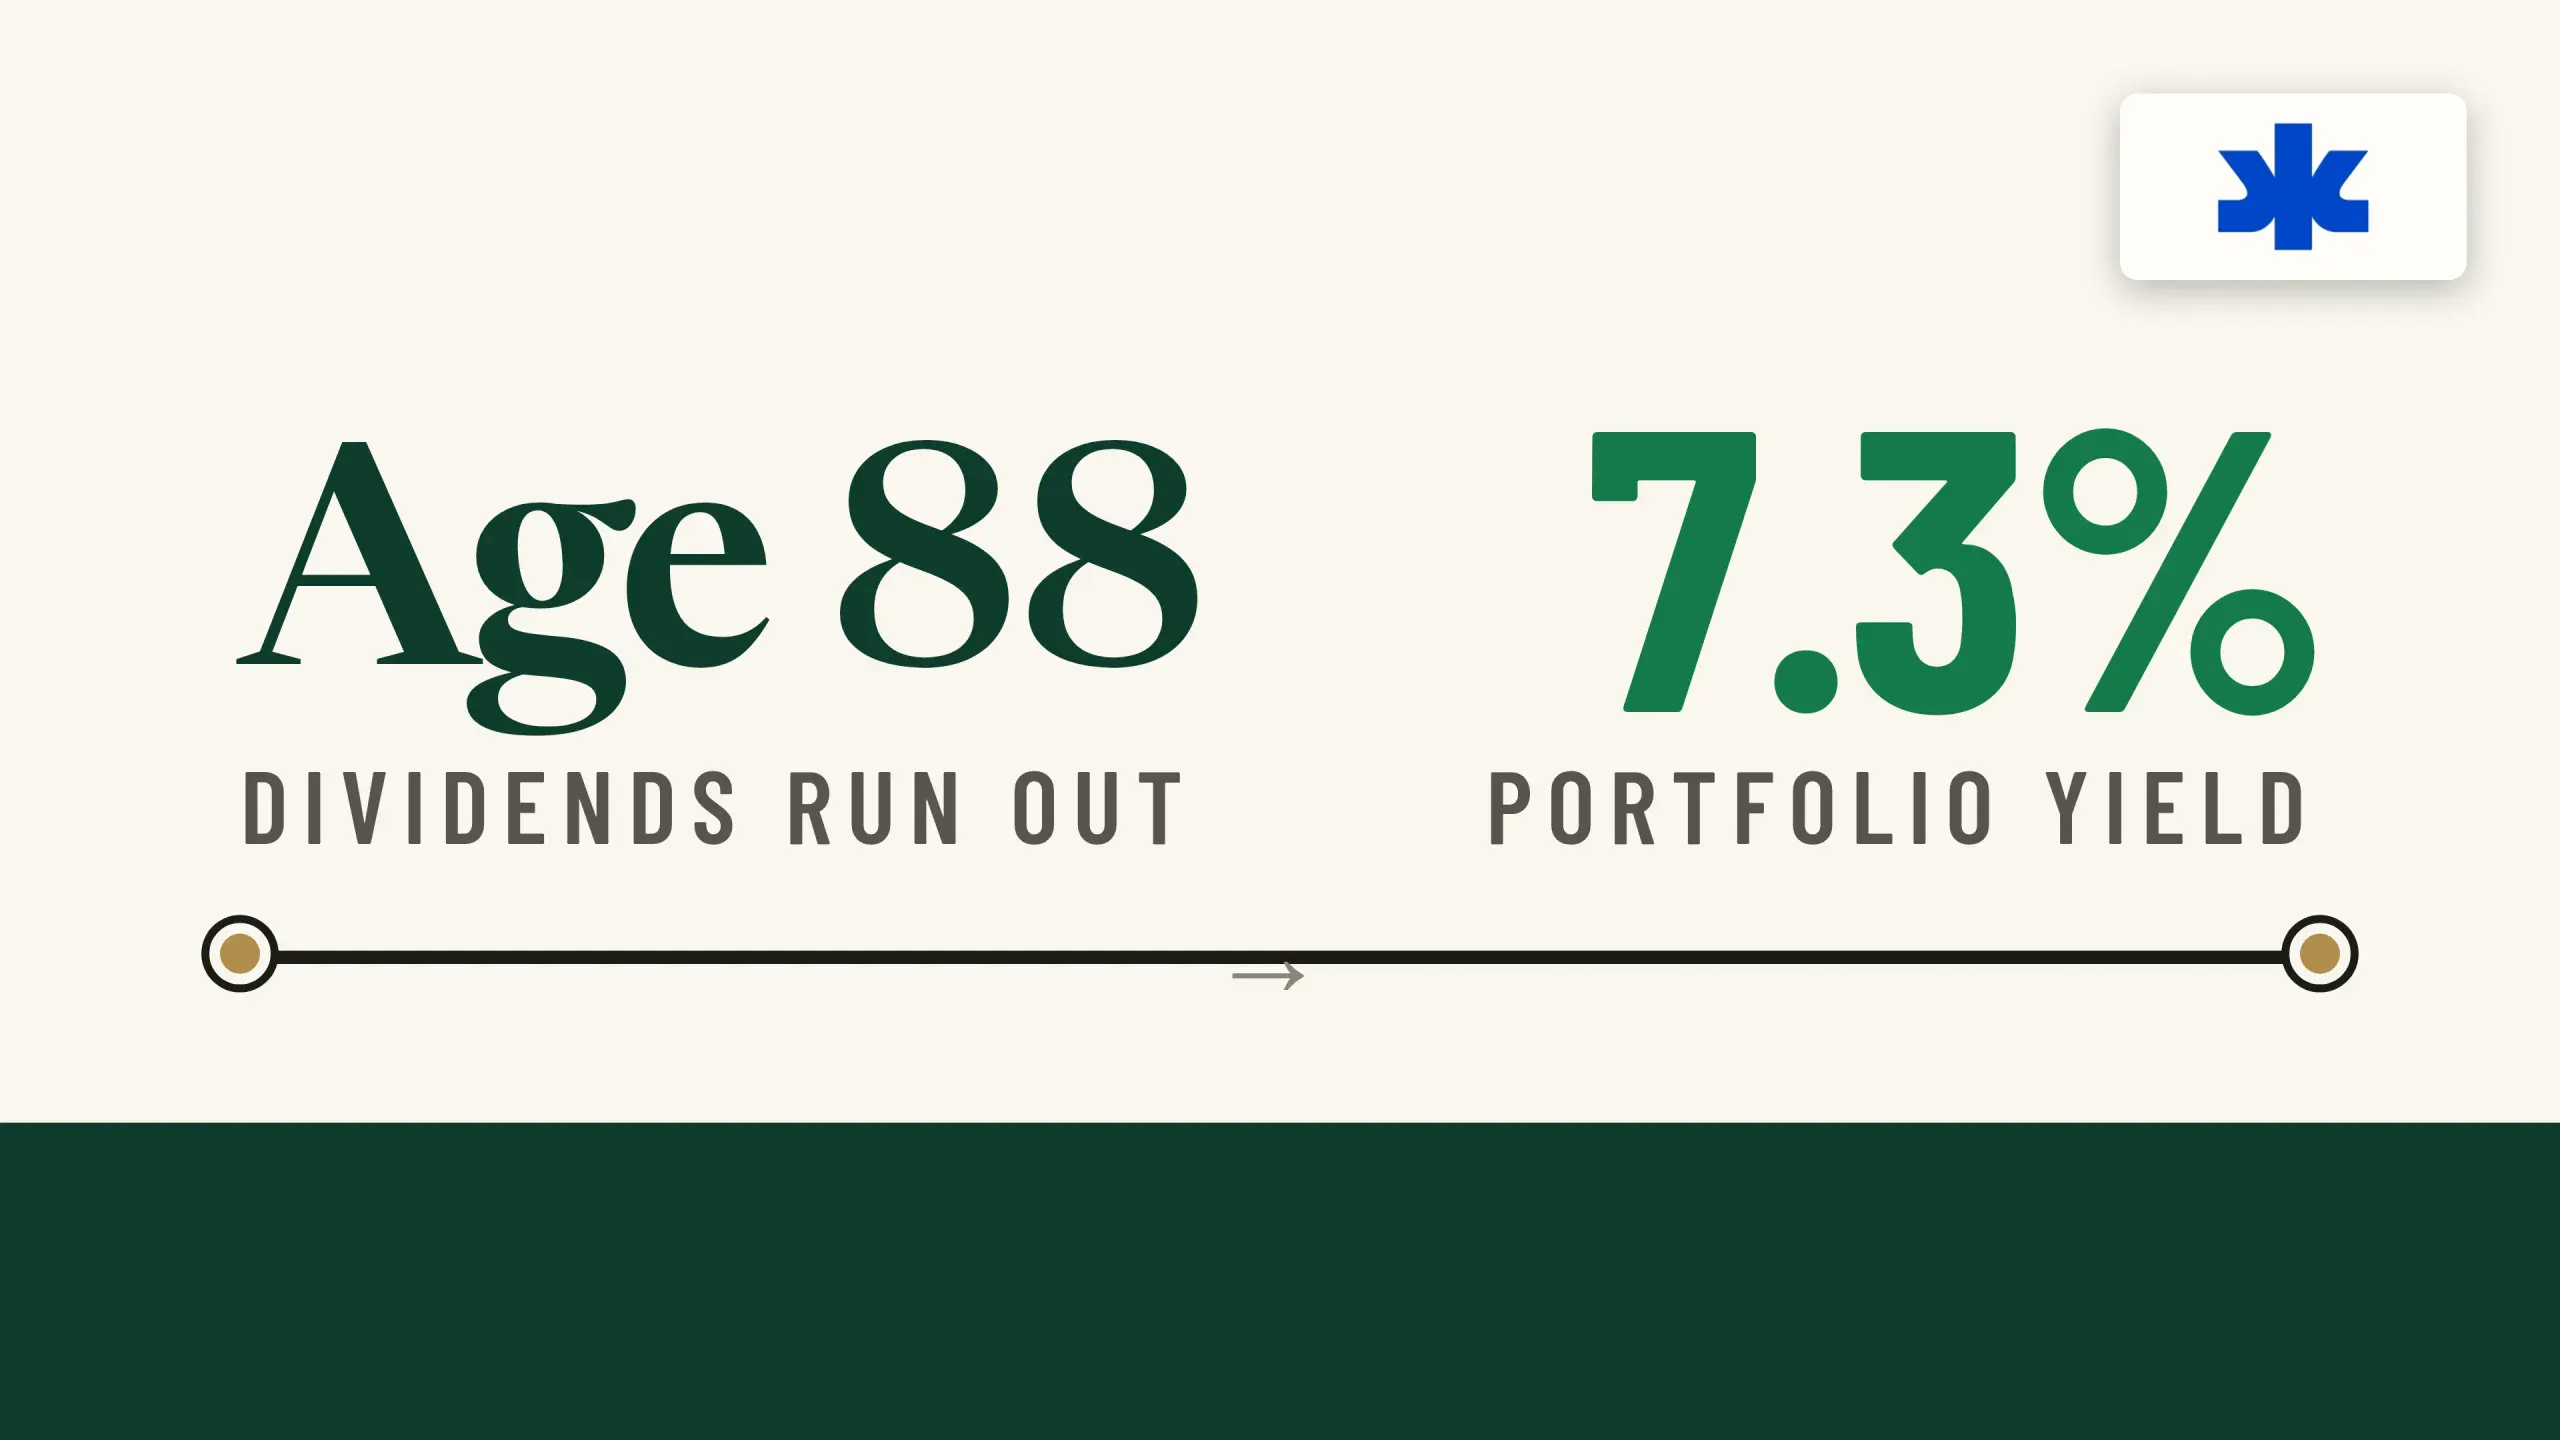 The Dividend Portfolio That Covers Your Required Minimum Distribution Without Selling a Share: KMB, BIZD, and SPHD
 Easy Income Portfolio: October 2026 Edition
 Easy Income Portfolio: September 2026 Edition
 Michael Burry Warns of a Private Credit 'Shell Game' That Could Leave Taxpayers on the Hook: APO, KKR, OWL In Focus
 Easy Income Portfolio: August 2026 Edition
 Easy Income Portfolio: July 2026 Edition
 Private Credit Turmoil Hits Blue Owl, Apollo Global and Ares As Their Stocks Sink
 Easy Income Portfolio: April 2026 Edition
 Easy Income Portfolio: March 2026 Edition
Your note
Sign in to keep a note on BIZD — it syncs with the Stock Master app.