

Ford Motor Company F
Regular-session close
After hours · Nov 20, 7:59 PM ET
- YTD
- -14.86%
- 1 year
- -9.99%
5D -0.65 (-5.49%)
- Market cap
- 44.60B
- Revenue (ttm)
- 186.97B
- Profit margin
- -4.17%
- EPS (ttm)
- -1.98
- Shares out
- 3.92B
- Forward P/E
- 5.97
- Dividend
- 0.60 (5.34%)
- Ex-dividend date
- Nov 10, 2026
- YTD return
- -14.86%
- 1-year return
- -9.99%
- Volume
- 57.50M
- Avg volume
- 43.95M
- Open
- 11.27
- Previous close
- 11.24
- Day's range
- 11.13 – 11.67
- 52-week range
- 11.17 – 17.44
- Beta
- 1.91
- Analysts
- Buy
- Price target
- 15.02 (+34.4%)
- Earnings date
- Feb 9, 2027
Key statistics
- 50-day average
- 12.35
- 200-day average
- 13.23
- Enterprise value
- 185.27B
- PEG ratio
- 8.48
- Price / sales
- 0.24
- Price / book
- 1.21
- Payout ratio
- 64.10%
- Revenue growth
- -2.00%
- Free cash flow
- -6.19B
- Total cash
- 25.09B
- Total debt
- 165.43B
- Return on equity
- -18.43%
Fundamental scorecard
7 of 25 checks passed on F’s reported financials
7of 25 checks passed
- Value 2 of 5
- Growth 1 of 5
- Profitability 0 of 5
- Financial health 1 of 5
- Dividend 3 of 5
Statements to Sep 30, 2026.
Analyst view
Consensus: buy
- Target (low)
- 12.00
- Target (mean)
- 15.02
- Target (high)
- 20.00
- Strong buy3
- Buy5
- Hold12
- Sell0
- Strong sell0
Next earnings
Feb 9, 2027
Expected Feb 9, 2027. Consensus EPS estimate 0.35251.
Financials — quick view
Earnings
| Report date | Quarter ending | EPS estimate | EPS reported | Surprise | Surprise % |
|---|---|---|---|---|---|
| Feb 9, 2027 | Dec 30, 2026 | 0.35 | — | — | — |
| Oct 28, 2026 | Sep 30, 2026 | 0.4099 | 0.49 | +0.08 | +19.54% |
| Jul 28, 2026 | Jun 30, 2026 | 0.3586 | 0.42 | +0.06 | +17.12% |
| Apr 29, 2026 | Mar 31, 2026 | 0.20 | 0.66 | +0.46 | +230.00% |
| Feb 10, 2026 | Dec 31, 2025 | 0.1793 | 0.13 | -0.05 | -27.50% |
| Oct 23, 2025 | Sep 30, 2025 | 0.3539 | 0.45 | +0.10 | +27.15% |
Upgrades / downgrades
| Date | Firm | Action | From | To |
|---|---|---|---|---|
| Oct 29, 2026 | RBC Capital | main | Sector Perform | Sector Perform |
| Oct 29, 2026 | BNP Paribas | main | Neutral | Neutral |
| Oct 29, 2026 | Morgan Stanley | main | Equal-Weight | Equal-Weight |
| Oct 29, 2026 | Goldman Sachs | main | Neutral | Neutral |
| Oct 12, 2026 | JP Morgan | main | Overweight | Overweight |
| Oct 7, 2026 | UBS | main | Buy | Buy |
About Ford Motor Company
Ford Motor Company develops, delivers, and services Ford trucks, sport utility vehicles, commercial vans and cars, and Lincoln luxury vehicles in the United States, Canada, the United Kingdom, Mexico, and internationally. It operates through Ford Blue, Ford Model e, Ford Pro, and Ford Credit segments. The company sells Ford and Lincoln internal combustion engine and hybrid vehicles, electric vehicles, service parts, accessories, and digital services for retail customers; develops EV and digital vehicle technologies, and software; and provides telematics and EV charging solutions. It also sells Ford and Lincoln vehicles, service parts, and accessories through distributors and dealers, as well as through dealerships to commercial fleet customers, daily rental car companies, and governments. In addition, it engages in vehicle-related financing and leasing activities to and through automotive dealers. Further, the company provides retail installment sale contracts for new and used vehicles; and direct financing leases for new vehicles to retail and commercial customers, such as leasing companies, government entities, daily rental companies, and fleet customers. Additionally, it offers wholesale loans to dealers to finance the purchase of vehicle inventory; and loans to dealers to finance working capital and enhance dealership facilities, purchase dealership real estate, and other dealer vehicle programs. Ford Motor Company was incorporated in 1903 and is based in Dearborn, Michigan.
- Sector
- Consumer Cyclical
- Industry
- Auto Manufacturers
- Country
- United States
- Website
- ford.com
News
 Pentagon Memo Restricts Casual US-Canada Military Contact, Sen. Mike Rounds Says
 He Borrowed $20,000 From His 401(k) to Restore a Classic Car. Leaving His Job at 52 to Become an Auto Technician Turns the Unpaid Loan Into a Taxable Withdrawal: $2,000 in Penalty Plus About $4,400 in Income Tax
 Is Ford Stock A Buy?
 Canada Pledges C$464.5M Investment In Ford’s Oakville Assembly Complex Through Its Strategic Response Fund
 Ford And GM Saved By US Government, Again
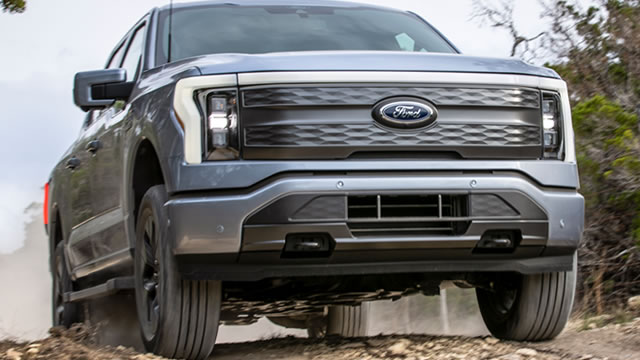 Ford: The Market Is Pricing Model e's Losses As Permanent
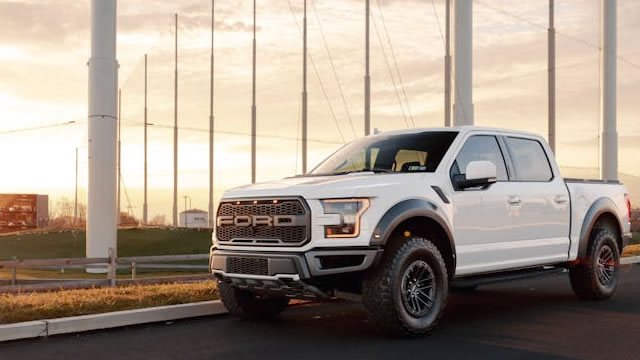 Ford Begins Shipping LFP Batteries: Is F Stock a Buy Now?
 Why Ford Motor Company (F) is a Top Value Stock for the Long-Term
 Ford Stock Looks Cheap. It Just Got a Buy Upgrade.
 Ford Yields 5.27%, but These 3 Auto Dividends Come With Different Risks
Your note
Sign in to keep a note on F — it syncs with the Stock Master app.
Institution ownership
| Holder | % held | Shares | Value | Reported |
|---|---|---|---|---|
| Blackrock Inc. | 8.49% | 333,049,863 | 3.72B | Sep 29, 2026 |
| Vanguard Capital Management LLC | 6.53% | 256,234,350 | 2.86B | Sep 29, 2026 |
| State Street Corporation | 4.94% | 193,794,379 | 2.16B | Sep 29, 2026 |
| Vanguard Portfolio Management LLC | 4.59% | 180,096,385 | 2.01B | Sep 29, 2026 |
| Charles Schwab Investment Management, Inc. | 3.75% | 146,909,724 | 1.64B | Sep 29, 2026 |
| Newport Trust Company, LLC | 3.42% | 134,084,677 | 1.50B | Sep 29, 2026 |
Fund ownership
| Holder | % held | Shares | Value | Reported |
|---|---|---|---|---|
| VANGUARD INDEX FUNDS-Vanguard Total Stock Market Index Fund | 3.17% | 124,254,899 | 1.39B | Jun 29, 2026 |
| SCHWAB STRATEGIC TRUST-Schwab US Dividend Equity ETF | 2.73% | 107,028,864 | 1.19B | Aug 30, 2026 |
| VANGUARD INDEX FUNDS-Vanguard 500 Index Fund | 2.59% | 101,420,902 | 1.13B | Jun 29, 2026 |
| VANGUARD INDEX FUNDS-Vanguard Mid-Cap Index Fund | 2.16% | 84,804,972 | 946.00M | Jun 29, 2026 |
| iShares Trust-iShares Core S&P 500 ETF | 1.33% | 52,190,203 | 582.18M | Sep 29, 2026 |
| Fidelity Concord Street Trust-Fidelity 500 Index Fund | 1.30% | 50,901,904 | 567.81M | Sep 29, 2026 |