

Tesco PLC TSCDY
21.63 USD -0.42 (-1.90%)
At closeNov 3, 2026, 4:00 PM EST
21.67 Day range 21.77
16.65 52-week range 22.09
- YTD
- +20.23%
- 1 year
- +19.50%
- Market cap
- 44.68B
- EPS (ttm)
- 1.17
- P/E ratio
- 18.49
- YTD return
- +20.23%
- 1-year return
- +19.50%
- Volume
- 4.88K
- Avg volume
- 374.08K
- Open
- 21.77
- Previous close
- 22.05
- Day's range
- 21.67 – 21.77
- 52-week range
- 16.65 – 22.09
- Earnings date
- Oct 8, 2026
2Y +8.01 (+58.55%)
Next earnings
Oct 8, 2026
Expected Oct 8, 2026. Consensus EPS estimate 0.644.
Earnings
| Report date | Quarter ending | EPS estimate | EPS reported | Surprise | Surprise % |
|---|---|---|---|---|---|
| Oct 8, 2026 | Aug 28, 2026 | 0.644 | — | — | — |
| Apr 16, 2026 | Feb 28, 2026 | 0.536 | 0.551 | +0.02 | +2.80% |
| Oct 2, 2025 | Aug 23, 2025 | 0.576 | 0.621 | +0.05 | +7.81% |
| Apr 10, 2025 | Feb 28, 2025 | 0.4488 | 0.495 | +0.05 | +10.29% |
| Oct 3, 2024 | Aug 24, 2024 | 0.524 | 0.568 | +0.04 | +8.40% |
| Apr 10, 2024 | Feb 28, 2024 | 0.4428 | 0.4462 | 0.00 | +0.77% |
News
 Tesco to sell Czech, Slovak businesses to Ahold Delhaize in $1.9 billion deal
 TSCDY vs. WMT: Which Stock Is the Better Value Option?
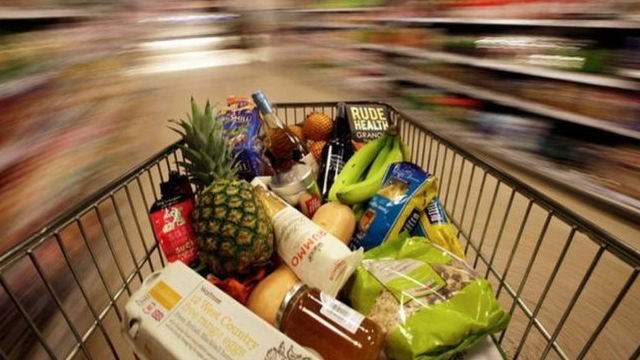 Is Tesco (TSCDY) Stock Undervalued Right Now?
 Citi says Tesco could gain from rapid grocery delivery at Sainsbury's expense
 Tesco shares jumped after earnings: is there more upside left?
 Tesco: Loved The Rally, But I'm Still Holding
 Tesco targets rise at Deutsche Bank and Jefferies, ratings diverge
 Tesco PLC (TSCDY) Q2 2027 Sales/Trading Call Transcript
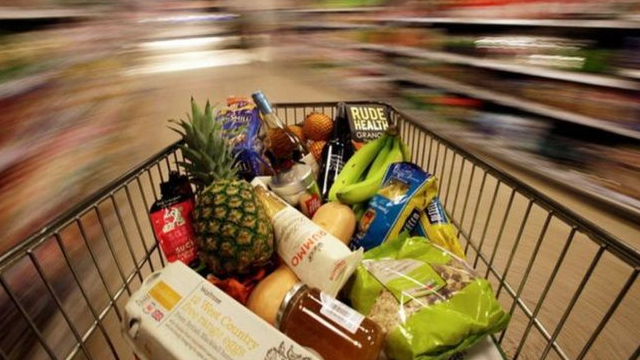 What Tesco (TSCO) Said on Its H1 Earnings Call
 Tesco expects moderation trend to curb festive alcohol sales
Your note
Sign in to keep a note on TSCDY — it syncs with the Stock Master app.