

Target Corporation TGT
At closeNov 3, 2026, 4:00 PM EST
After hours · Nov 3, 4:00 PM ET
- YTD
- +57.96%
- 1 year
- +68.84%
- Market cap
- 70.15B
- Revenue (ttm)
- 107.70B
- Profit margin
- 4.08%
- EPS (ttm)
- 9.63
- Shares out
- 454.29M
- P/E ratio
- 16.03
- Forward P/E
- 16.60
- Dividend
- 4.64 (3.01%)
- Ex-dividend date
- Nov 9, 2026
- YTD return
- +57.96%
- 1-year return
- +68.84%
- Volume
- 2.99M
- Avg volume
- 4.06M
- Open
- 158.19
- Previous close
- 158.38
- Day's range
- 152.05 – 158.35
- 52-week range
- 83.44 – 170.75
- Beta
- 0.93
- Analysts
- Buy
- Price target
- 163.35 (+5.8%)
- Earnings date
- Nov 18, 2026
3M +5.47 (+3.69%)
Key statistics
- Enterprise value
- 83.92B
- PEG ratio
- 2.11
- Price / sales
- 0.67
- Price / book
- 4.03
- Dividend yield
- 3.01%
- Payout ratio
- 47.35%
- Revenue growth
- 5.30%
- Free cash flow
- 3.43B
- Total cash
- 5.41B
- Total debt
- 19.20B
- Return on equity
- 26.41%
- Short % of float
- 3.74%
- 50-day average
- 157.15
- 200-day average
- 134.02
Analyst view
Consensus: buy
- Target (low)
- 128.00
- Target (mean)
- 163.35
- Target (high)
- 190.00
- Strong buy2
- Buy11
- Hold21
- Sell0
- Strong sell4
Next earnings
Nov 18, 2026
Expected Nov 18, 2026. Consensus EPS estimate 2.05.
Financials — quick view
Earnings
| Report date | Quarter ending | EPS estimate | EPS reported | Surprise | Surprise % |
|---|---|---|---|---|---|
| Nov 18, 2026 | Nov 1, 2026 | 2.05 | — | — | — |
| Aug 19, 2026 | Aug 1, 2026 | 2.35 | 4.11 | +1.76 | +74.89% |
| May 20, 2026 | May 2, 2026 | 1.47 | 1.71 | +0.24 | +16.33% |
| Mar 3, 2026 | Jan 31, 2026 | 2.16 | 2.44 | +0.28 | +12.96% |
| Nov 19, 2025 | Nov 1, 2025 | 1.71 | 1.78 | +0.07 | +4.09% |
| Aug 20, 2025 | Aug 2, 2025 | 2.04 | 2.05 | +0.01 | +0.49% |
Upgrades / downgrades
| Date | Firm | Action | From | To |
|---|---|---|---|---|
| Oct 13, 2026 | Evercore ISI Group | main | In-Line | In-Line |
| Sep 30, 2026 | HSBC | up | Hold | Buy |
| Aug 20, 2026 | Telsey Advisory Group | main | Outperform | Outperform |
| Aug 20, 2026 | Citigroup | main | Neutral | Neutral |
| Aug 20, 2026 | Goldman Sachs | main | Neutral | Neutral |
| Aug 20, 2026 | BMO Capital | main | Market Perform | Market Perform |
About Target Corporation
Target Corporation operates as a general merchandise retailer in the United States. It offers apparel for women, men, young adults, kids, toddlers, and babies, as well as jewelry, accessories, and shoes; and beauty products, such as skin and bath care, cosmetics, hair care, oral care, deodorant, and shaving products. The company also provides food and beverage products comprising dry and perishable grocery, including snacks, candy, beverages, deli, bakery, meat, produce, and food service; electronics which includes video games and consoles, toys, sporting goods, entertainment, and luggage; bed and bath, home décor, school/office supplies, storage, small appliances, kitchenware, greeting cards, party supplies, furniture, lighting, home improvement, and seasonal merchandise; and household essentials, such as household cleaning, paper products, over-the-counter healthcare, vitamins and supplements, baby gear, and pet supplies. In addition, it sells merchandise through periodic design and creative partnerships, and shop-in-shop experience; and in-store amenities. The company sells its products through its stores; and digital channels, including Target.com. Target Corporation was incorporated in 1902 and is headquartered in Minneapolis, Minnesota.
- Sector
- Consumer Defensive
- Industry
- Discount Stores
- Country
- United States
- Website
- corporate.target.com
News
 Cipher Digital Soars 11% as AI Data Center Stocks Rebound After Price-Target Selloff; IREN Jumps 10%, TeraWulf Surges 9%
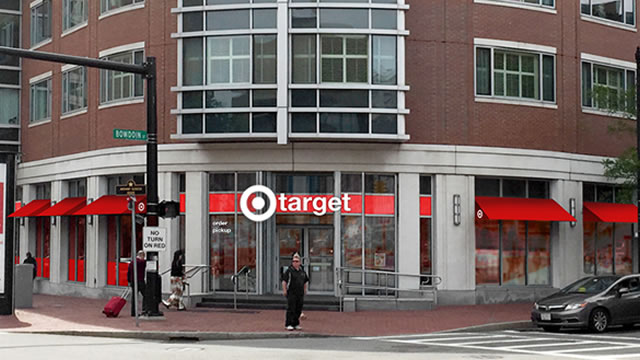 Target Corporation (TGT) is Attracting Investor Attention: Here is What You Should Know
 Spark Defines a 21 km2 Rare Earth Target at Boa Vista, Nearly Three Times the Cruzeta Footprint and Anchored by Drilling
 Stock Market Today, Nov. 2: Amazon Rallies on Phillip Securities Buy Upgrade and $330 Target
 Alibaba vs. Target: Comparing Revenue Trends Between Two Retail Titans
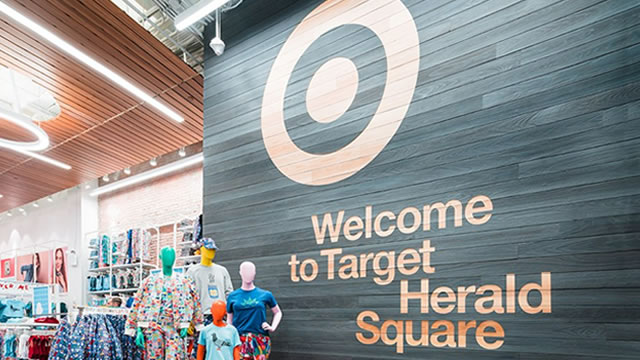 Are Target's Stores Becoming a Bigger E-commerce Growth Engine?
 Cipher Digital Falls 5% on Revenue Miss and Keefe Bruyette Target Cut; TeraWulf and IREN Drop 4%
 Target Hospitality Announces Third Quarter 2026 Earnings Release and Conference Call Schedule
 Qualcomm Earnings Preview: Its $15B AI Target Still Doesn't Justify Today's Prices
 OpenAI Cuts Funding Target Amid Meta, Microsoft Offerings, Anthropic IPO
Your note
Sign in to keep a note on TGT — it syncs with the Stock Master app.
Insider holders
| Insider | Relation | Latest transaction | Date | Shares held |
|---|---|---|---|---|
| BAKER DOUGLAS M JR | Director | Stock Award(Grant) | Mar 10, 2026 | 44,294 |
| CORNELL BRIAN C | Officer and Director | Sale | May 26, 2026 | 0 |
| FIDDELKE MICHAEL J. | Officer | Stock Award(Grant) | Apr 6, 2026 | 124,790 |
| GOMEZ RICHARD H | Officer | Stock Award(Grant) | Mar 11, 2025 | 133,005 |
| HENNINGTON CHRISTINA | Officer | Stock Award(Grant) | Apr 7, 2025 | 53,341 |
| KREMER MELISSA K | Officer | Sale | Aug 23, 2026 | 56,981 |
Institution ownership
| Holder | % held | Shares | Value | Reported |
|---|---|---|---|---|
| Blackrock Inc. | 8.52% | 38,699,974 | 6.13B | Jun 29, 2026 |
| State Street Corporation | 7.94% | 36,049,727 | 5.71B | Jun 29, 2026 |
| Vanguard Capital Management LLC | 6.53% | 29,644,004 | 4.70B | Jun 29, 2026 |
| FMR, LLC | 5.42% | 24,630,329 | 3.90B | Jun 29, 2026 |
| Vanguard Portfolio Management LLC | 4.86% | 22,057,164 | 3.50B | Jun 29, 2026 |
| Charles Schwab Investment Management, Inc. | 3.40% | 15,448,336 | 2.45B | Jun 29, 2026 |
Fund ownership
| Holder | % held | Shares | Value | Reported |
|---|---|---|---|---|
| VANGUARD INDEX FUNDS-Vanguard Total Stock Market Index Fund | 3.17% | 14,416,685 | 2.28B | Jun 29, 2026 |
| SCHWAB STRATEGIC TRUST-Schwab US Dividend Equity ETF | 2.73% | 12,419,237 | 1.97B | Aug 30, 2026 |
| VANGUARD INDEX FUNDS-Vanguard 500 Index Fund | 2.59% | 11,771,259 | 1.87B | Jun 29, 2026 |
| VANGUARD INDEX FUNDS-Vanguard Mid-Cap Index Fund | 2.17% | 9,841,022 | 1.56B | Jun 29, 2026 |
| iShares Trust-iShares Core S&P 500 ETF | 1.33% | 6,051,747 | 958.99M | Sep 29, 2026 |
| Fidelity Concord Street Trust-Fidelity 500 Index Fund | 1.30% | 5,895,614 | 934.25M | Aug 30, 2026 |