

Invesco QQQ Trust QQQ
691.95 USD +6.67 (+0.97%)
At closeNov 4, 2026, 6:46 PM EST
691.74 -0.21 -0.03%
After hours · Nov 4, 6:46 PM ET
687.90 Day range 701.45
555.60 52-week range 762.86
- YTD
- +12.64%
- 1 year
- +11.74%
- Market cap
- 464.24B
- EPS (ttm)
- 26.12
- P/E ratio
- 26.50
- YTD return
- +12.64%
- 1-year return
- +11.74%
- Volume
- 61.90M
- Avg volume
- 34.90M
- Open
- 688.43
- Previous close
- 685.28
- Day's range
- 687.90 – 701.45
- 52-week range
- 555.60 – 762.86
- Earnings date
- Feb 15, 2005
5Y +293.35 (+73.60%)
Key statistics
- Enterprise value
- 0
- PEG ratio
- 0.00
- Price / sales
- 0.00
- Price / book
- 0.00
- Dividend yield
- 0.00%
- Payout ratio
- 0.00%
- Revenue growth
- 0.00%
- Free cash flow
- 0
- Total cash
- 0
- Total debt
- 0
- Return on equity
- 0.00%
- Short % of float
- 0.00%
- 50-day average
- 723.93
- 200-day average
- 680.14
Next earnings
Feb 15, 2005
Expected Feb 15, 2005. Consensus EPS estimate 0.00.
Earnings
| Report date | Quarter ending | EPS estimate | EPS reported | Surprise | Surprise % |
|---|---|---|---|---|---|
| Feb 15, 2005 | Sep 30, 2004 | 0.35 | — | — | — |
About Invesco QQQ Trust
To maintain the correspondence between the composition and weights of the securities in the trust (the "securities") and the stocks in the NASDAQ-100 Index®, the adviser adjusts the securities from time to time to conform to periodic changes in the identity and/or relative weights of index securities. The composition and weighting of the securities portion of a portfolio deposit are also adjusted to conform to changes in the index.
News
 QUICK SPARK: Trump Celebrates Stock Rally Fueled by His Own Party’s Midterm Defeat
 Dow Rallies 2.9%, Oil Sinks 7% After Midterms: Stock Market Today
 Why Investors May Be Getting The Blue Wave Trade Wrong; Iran Remains The Wild Card
 8 Of 11 Sectors Rise Wednesday As Growth Leads
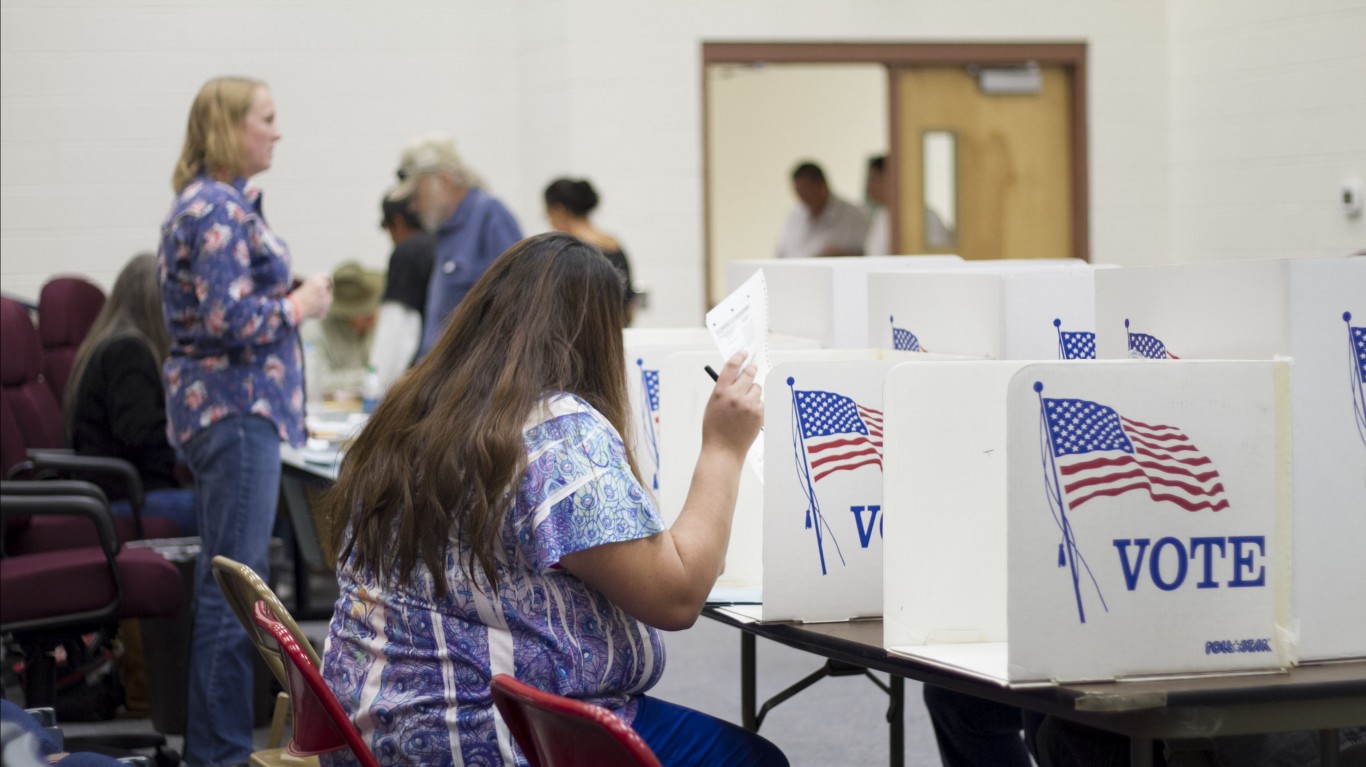 Midterm Elections Are Over. Here’s What History Says About the Next 12 Months
 Hard To Imagine A Retirement Portfolio Without These 2 Dividend Machines
 Dan Ives Says Democratic Sweep Will Slow AI Buildout, Estimates 10% Of Planned US Data Centers ‘Will Not Happen Now’
 Stock Market Today: Dow Jones, S&P 500, Nasdaq 100 Futures Rise as Democrats Take Control of Congress—AMD, AMGN, NVO in Focus (UPDATED)
 Associated Banc Corp Buys 24,337 Shares of Invesco QQQ $QQQ
 'Worst Possible Combination:' Top Analyst Warns of Trump White House With Democratic Congress — Here's What the S&P 500 Has Historically Averaged
Your note
Sign in to keep a note on QQQ — it syncs with the Stock Master app.