

Petróleo Brasileiro S.A. - Petrobras PBR
At closeNov 12, 2026, 5:12 PM EST
After hours · Nov 12, 5:12 PM ET
- YTD
- +52.74%
- 1 year
- +39.45%
- Market cap
- 116.64B
- Revenue (ttm)
- 120.57B
- Profit margin
- 23.96%
- EPS (ttm)
- 3.96
- Shares out
- 3.72B
- P/E ratio
- 4.57
- Forward P/E
- 4.25
- Dividend
- 1.43 (7.82%)
- Ex-dividend date
- Aug 24, 2026
- YTD return
- +52.74%
- 1-year return
- +39.45%
- Volume
- 19.51M
- Avg volume
- 24.52M
- Open
- 17.77
- Previous close
- 17.82
- Day's range
- 17.64 – 18.23
- 52-week range
- 11.43 – 26.39
- Analysts
- Buy
- Price target
- 23.26 (+28.5%)
- Earnings date
- Mar 4, 2027
5D -0.61 (-3.26%)
Key statistics
- Enterprise value
- 172.90B
- PEG ratio
- 6.01
- Price / sales
- 0.97
- Price / book
- 2.82
- Dividend yield
- 8.02%
- Payout ratio
- 28.93%
- Revenue growth
- 33.50%
- Free cash flow
- 22.46B
- Total cash
- 12.09B
- Total debt
- 69.97B
- Return on equity
- 32.23%
- Short % of float
- 2.13%
- 50-day average
- 22.06
- 200-day average
- 19.36
Analyst view
Consensus: buy
- Target (low)
- 17.40
- Target (mean)
- 23.26
- Target (high)
- 27.00
- Strong buy3
- Buy8
- Hold3
- Sell0
- Strong sell0
Next earnings
Mar 4, 2027
Expected Mar 4, 2027. Consensus EPS estimate 1.41.
Financials — quick view
Earnings
| Report date | Quarter ending | EPS estimate | EPS reported | Surprise | Surprise % |
|---|---|---|---|---|---|
| Mar 4, 2027 | Dec 30, 2026 | 1.34 | — | — | — |
| Nov 10, 2026 | Sep 30, 2026 | 1.32 | 1.20 | -0.12 | -9.09% |
| Aug 6, 2026 | Jun 30, 2026 | 1.40 | 1.62 | +0.22 | +15.71% |
| May 11, 2026 | Mar 31, 2026 | 1.02 | 0.96 | -0.06 | -5.88% |
| Mar 5, 2026 | Dec 31, 2025 | 0.57 | 0.72 | +0.15 | +26.32% |
| Nov 6, 2025 | Sep 30, 2025 | 0.79 | 0.82 | +0.03 | +3.80% |
Upgrades / downgrades
| Date | Firm | Action | From | To |
|---|---|---|---|---|
| Sep 23, 2026 | UBS | main | Buy | Buy |
| Sep 1, 2026 | JP Morgan | main | Overweight | Overweight |
| Jun 3, 2026 | JP Morgan | main | Overweight | Overweight |
| Apr 17, 2026 | B of A Securities | up | Neutral | Buy |
| Mar 13, 2026 | Jefferies | down | Buy | Hold |
| Feb 11, 2026 | Goldman Sachs | main | Buy | Buy |
About Petróleo Brasileiro S.A. - Petrobras
Petróleo Brasileiro S.A. - Petrobras explores, produces, and sells oil and gas in Brazil, China, the United States, the Americas, Asia, Europe, Singapore, and internationally. It operates through three segments: Exploration and Production; Refining, Transportation & Marketing; and Gas & Low Carbon Energies. The Exploration and Production segment explores, develops, and produces crude oil, natural gas liquids, and natural gas primarily for supplies to the domestic refineries. Its Refining, Transportation and Marketing segment engages in the refining, logistics, transport, acquisition, and export of crude oil; trading of oil products; and production of fertilizers, as well as holding interests in petrochemical companies. The Gas and Low Carbon Energies segment is involved in the logistic and trading of natural gas and electricity; transportation and trading of liquefied natural gas; generation of electricity through thermoelectric power plants; renewable energy business; low carbon business; and natural gas processing business, as well as production of biodiesel and its co-products. It also engages in prospecting, drilling, refining, processing, trading, and transporting crude oil from producing onshore and offshore oil fields, and shale or other rocks, as well as oil products, natural gas, and other liquid hydrocarbons. In addition, the company engages in research, development, production, transportation, distribution, and trading of energy. Petróleo Brasileiro S.A. - Petrobras was incorporated in 1953 and is headquartered in Rio De Janeiro, Brazil.
- Sector
- Energy
- Industry
- Oil & Gas Integrated
- Country
- Brazil
- Website
- petrobras.com.br
News
 Petrobras Lifts 2026 Cash Flow Forecast on Higher Oil Production
 Petrobras: Record Earnings, Shrinking Dividends, And The Lula IV Problem
 Petroleo Brasileiro S.A.- Petrobras Q3 Earnings Call Highlights
 Brazil to send energy minister to Venezuela amid Petrobras interest
 Brazil's Petrobras to increase production capacity at another six oil platforms
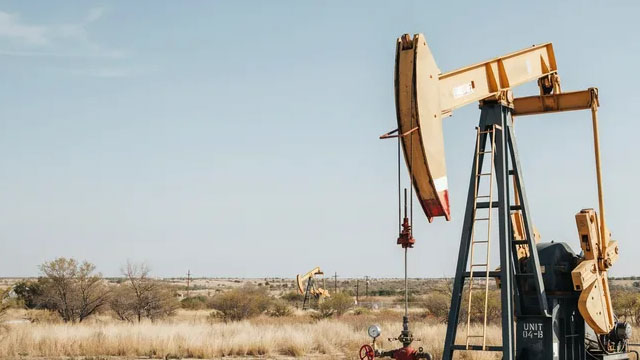 Brazil's Petrobras posts 21.5% rise in third-quarter net profit
 Petrobras, TransDigm On Deck Tuesday As Oil Profits, Aerospace Demand Face Test
 Petrobras Signs 3-Year Deal With RINA for Subsea Asset Management
 Petrobras Strengthens Oil Spill Response With New Vessel Charter
 Petrobras to Report Q3 Earnings: What's in the Cards for the Stock?
Your note
Sign in to keep a note on PBR — it syncs with the Stock Master app.
Institution ownership
| Holder | % held | Shares | Value | Reported |
|---|---|---|---|---|
| GQG Partners LLC | 5.19% | 193,198,230 | 3.50B | Jun 29, 2026 |
| BAILLIE GIFFORD & CO | 1.16% | 43,088,321 | 780.11M | Sep 29, 2026 |
| Arrowstreet Capital, Limited Partnership | 1.08% | 40,190,550 | 727.65M | Jun 29, 2026 |
| Capital International Investors | 1.02% | 38,068,192 | 689.22M | Jun 29, 2026 |
| Capital World Investors | 0.79% | 29,419,512 | 532.64M | Jun 29, 2026 |
| Invesco Ltd. | 0.74% | 27,481,902 | 497.56M | Jun 29, 2026 |
Fund ownership
| Holder | % held | Shares | Value | Reported |
|---|---|---|---|---|
| Goldman Sachs TRT II-Goldman Sachs GQG Part. Intl Opportunities Fd. | 1.70% | 63,204,982 | 1.14B | Jul 30, 2026 |
| ADVISORS' INNER CIRCLE III-GQG PARTNERS EMERGING MARKETS EQUITY FUND | 1.39% | 51,669,775 | 935.48M | Jun 29, 2026 |
| New World Fund Inc | 0.66% | 24,603,809 | 445.45M | Sep 29, 2026 |
| AIM Investment Fd.s -Invesco Developing Markets Fd. | 0.39% | 14,584,406 | 264.05M | Jul 30, 2026 |
| AMERICAN BALANCED FUND | 0.38% | 13,999,019 | 253.45M | Sep 29, 2026 |
| iShares Trust-iShares Latin America 40 ETF | 0.30% | 11,095,533 | 200.88M | Sep 29, 2026 |