

NextEra Energy, Inc. NEE
At closeNov 5, 2026, 4:30 AM EST
Pre-market · Nov 5, 4:30 AM ET
- YTD
- +10.18%
- 1 year
- +8.28%
- Market cap
- 185.51B
- Revenue (ttm)
- 28.82B
- Profit margin
- 40.37%
- EPS (ttm)
- 5.55
- Shares out
- 2.10B
- P/E ratio
- 15.94
- Forward P/E
- 20.21
- Dividend
- 2.49 (2.96%)
- Ex-dividend date
- Nov 26, 2026
- YTD return
- +10.18%
- 1-year return
- +8.28%
- Volume
- 27.43M
- Avg volume
- 11.74M
- Open
- 87.47
- Previous close
- 84.33
- Day's range
- 86.49 – 88.79
- 52-week range
- 74.41 – 98.75
- Beta
- 0.60
- Analysts
- Buy
- Price target
- 94.00 (+6.3%)
- Earnings date
- Jan 26, 2027
2Y +9.80 (+12.46%)
Key statistics
- Enterprise value
- 298.06B
- PEG ratio
- 1.72
- Price / sales
- 6.43
- Price / book
- 3.02
- Dividend yield
- 2.96%
- Payout ratio
- 43.89%
- Revenue growth
- 1.60%
- Free cash flow
- -21.21B
- Total cash
- 5.58B
- Total debt
- 113.93B
- Return on equity
- 14.06%
- Short % of float
- 0.00%
- 50-day average
- 80.27
- 200-day average
- 87.33
Analyst view
Consensus: buy
- Target (low)
- 56.00
- Target (mean)
- 94.00
- Target (high)
- 110.00
- Strong buy2
- Buy12
- Hold7
- Sell1
- Strong sell0
Next earnings
Jan 26, 2027
Expected Jan 26, 2027. Consensus EPS estimate 0.57344.
Financials — quick view
Earnings
| Report date | Quarter ending | EPS estimate | EPS reported | Surprise | Surprise % |
|---|---|---|---|---|---|
| Jan 26, 2027 | Dec 30, 2026 | 0.59 | — | — | — |
| Oct 21, 2026 | Sep 30, 2026 | 1.20 | 1.24 | +0.04 | +3.33% |
| Jul 24, 2026 | Jun 30, 2026 | 1.09 | 1.15 | +0.06 | +5.50% |
| Apr 23, 2026 | Mar 31, 2026 | 1.03 | 1.09 | +0.06 | +5.83% |
| Jan 27, 2026 | Dec 31, 2025 | 0.56 | 0.53 | -0.03 | -5.36% |
| Oct 28, 2025 | Sep 30, 2025 | 0.967 | 1.13 | +0.16 | +16.86% |
Upgrades / downgrades
| Date | Firm | Action | From | To |
|---|---|---|---|---|
| Oct 23, 2026 | Barclays | main | Equal-Weight | Equal-Weight |
| Oct 21, 2026 | Bernstein | reit | Outperform | Outperform |
| Oct 20, 2026 | BMO Capital | main | Outperform | Outperform |
| Oct 19, 2026 | Barclays | main | Equal-Weight | Equal-Weight |
| Oct 14, 2026 | Morgan Stanley | main | Overweight | Overweight |
| Oct 6, 2026 | Mizuho | main | Neutral | Neutral |
About NextEra Energy, Inc.
NextEra Energy, Inc., through its subsidiaries, generates, stores, transmits, distributes, and sells electric power to retail and wholesale customers in North America. It operates through Florida Power & Light Company (FPL) and NEER segments. The company generates electricity from wind, solar, nuclear, natural gas, and other clean energy assets. It also invests in generation, storage, transmission, and distribution facilities; owns, develops, constructs, manages, and operates generation facilities, including renewables, nuclear and natural gas, and battery storage facilities in the wholesale energy market in the United States and Canada, as well as electric and gas transmission assets, and natural gas pipelines; provides full energy and capacity requirement services; markets and trades in energy-related commodities; and participates in the production of natural gas, natural gas liquids, and oil. As of December 31, 2025, the company had approximately 35,963 megawatts of net generating capacity; approximately 93,000 circuit miles of transmission and distribution lines; and 932 substations. It serves approximately 12 million people through approximately 6 million customer accounts on the east and lower west coasts of Florida. The company was formerly known as FPL Group, Inc. and changed its name to NextEra Energy, Inc. in 2010. NextEra Energy, Inc. was founded in 1925 and is headquartered in Juno Beach, Florida.
- Sector
- Utilities
- Industry
- Utilities - Regulated Electric
- Country
- United States
- Website
- nexteraenergy.com
News
 Mine, Enrich, Build, Operate: Which Link in the Nuclear Supply Chain Is the Best Stock Right Now?
 First Solar Stock, Peers Shine as Democrats Win Congress: What Midterm Results Mean for Solar Policy?
 NextEra Energy, Inc. $NEE Stock Position Lessened by International Assets Investment Management LLC
 Nearly Two-Thirds of NextEra's New Backlog Last Quarter Was Batteries. Here's Why That Matters.
 Reported Earlier, NextEra Energy And Dominion Energy File Rebuttal Testimony Regarding Their Merger To State Of Virginia With Additional Customer And Financial Protections
 NextEra Energy and Dominion Energy strengthen historic Virginia benefits package with additional customer and financial safeguards
 NextEra Energy and Dominion Energy strengthen historic Virginia benefits package with additional customer and financial safeguards
 Top 25 Attractive Dividend Stocks For November 2026
 Constellation Energy vs. NextEra Energy: Which Utilities Stock Is a Better Buy for 2027?
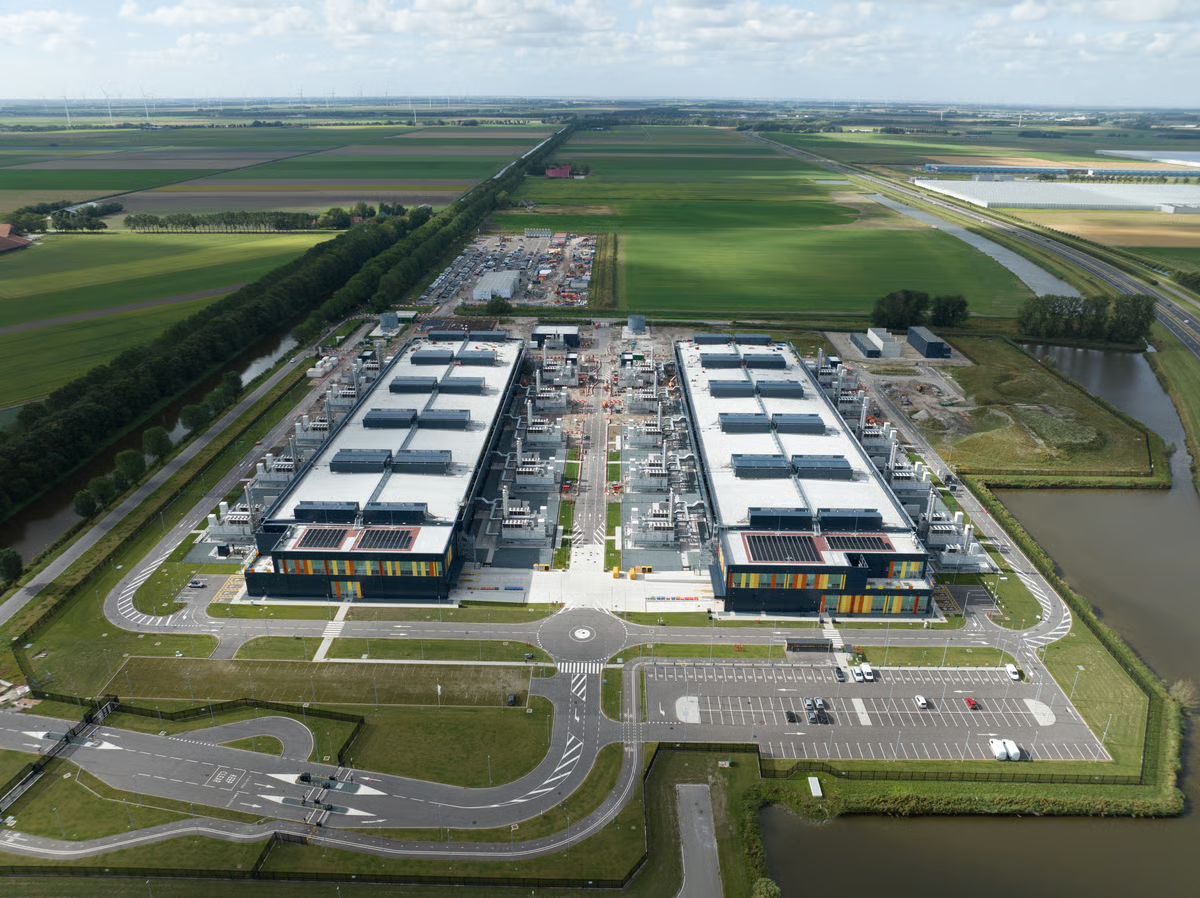 5 AI Infrastructure Stocks to Buy and Hold Through 2030
Your note
Sign in to keep a note on NEE — it syncs with the Stock Master app.
Insider holders
| Insider | Relation | Latest transaction | Date | Shares held |
|---|---|---|---|---|
| CAMAREN JAMES LAWRENCE | Director | Stock Award(Grant) | Feb 11, 2026 | 166,450 |
| COFFEY ROBERT | Officer | Stock Award(Grant) | Feb 11, 2026 | 55,962 |
| CREWS TERRELL KIRK II | Officer | Sale | Mar 8, 2026 | 77,148 |
| DUNNE MICHAEL | Chief Financial Officer | Sale | Nov 1, 2026 | 65,184 |
| HACHIGIAN KIRK S | Director | Stock Award(Grant) | Feb 11, 2026 | 102,492 |
| KETCHUM JOHN W. | Chief Executive Officer | Stock Award(Grant) | Feb 11, 2026 | 412,595 |
Institution ownership
| Holder | % held | Shares | Value | Reported |
|---|---|---|---|---|
| Blackrock Inc. | 8.91% | 186,838,459 | 16.52B | Jun 29, 2026 |
| Vanguard Capital Management LLC | 6.49% | 136,210,944 | 12.05B | Jun 29, 2026 |
| State Street Corporation | 5.67% | 118,952,736 | 10.52B | Jun 29, 2026 |
| JPMORGAN CHASE & CO | 5.53% | 116,048,771 | 10.26B | Jun 29, 2026 |
| Morgan Stanley | 3.03% | 63,514,030 | 5.62B | Jun 29, 2026 |
| Vanguard Portfolio Management LLC | 2.97% | 62,243,168 | 5.50B | Jun 29, 2026 |
Fund ownership
| Holder | % held | Shares | Value | Reported |
|---|---|---|---|---|
| VANGUARD INDEX FUNDS-Vanguard Total Stock Market Index Fund | 3.16% | 66,202,106 | 5.85B | Jun 29, 2026 |
| VANGUARD INDEX FUNDS-Vanguard 500 Index Fund | 2.58% | 54,040,050 | 4.78B | Jun 29, 2026 |
| SELECT SECTOR SPDR TRUST-State Street Utilities Select Sector SPDR ETF | 1.76% | 36,913,639 | 3.26B | Sep 29, 2026 |
| iShares Trust-iShares Core S&P 500 ETF | 1.33% | 27,795,017 | 2.46B | Sep 29, 2026 |
| Fidelity Concord Street Trust-Fidelity 500 Index Fund | 1.29% | 27,109,308 | 2.40B | Sep 29, 2026 |
| SPDR S&P 500 ETF TRUST-State Street SPDR S&P 500 ETF Trust | 1.23% | 25,838,109 | 2.29B | Sep 29, 2026 |