

Mannatech, Incorporated MTEX
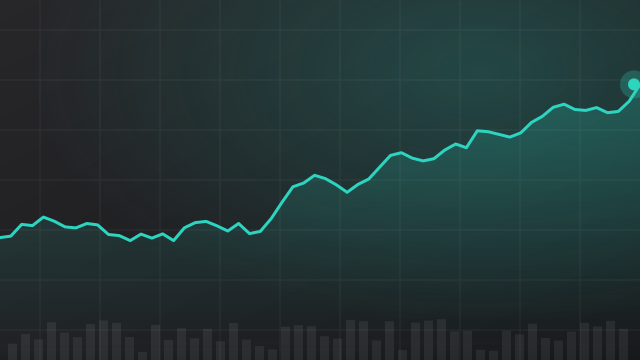
2.56 USD +0.13 (+5.13%)
Regular-session close
2.56 0.00 0.00%
After hours · Nov 20, 4:00 PM ET
2.50 Day range 2.79
2.45 52-week range 9.84
- YTD
- -68.97%
- 1 year
- -73.58%
5D -2.79 (-52.15%)
- Market cap
- 4.94M
- Revenue (ttm)
- 122.38M
- Profit margin
- -0.97%
- EPS (ttm)
- -0.31
- Shares out
- 1.88M
- Dividend
- 0.80 (10.03%)
- Ex-dividend date
- Jun 14, 2023
- YTD return
- -68.97%
- 1-year return
- -73.58%
- Volume
- 10.21K
- Avg volume
- 37.08K
- Open
- 2.79
- Previous close
- 2.44
- Day's range
- 2.50 – 2.79
- 52-week range
- 2.45 – 9.84
- Beta
- 1.16
- 50-day average
- 8.92
- 200-day average
- 8.01
Key statistics
- Enterprise value
- 13.65M
- Price / sales
- 0.18
- Price / book
- 2.06
- Revenue growth
- -14.90%
- Free cash flow
- -269.00K
- Total cash
- 9.20M
- Total debt
- 8.71M
- Return on equity
- -11.92%
- Short % of float
- 0.19%
Fundamental scorecard
7 of 25 checks passed on MTEX’s reported financials
7of 25 checks passed
- Value 2 of 5
- Growth 1 of 5
- Profitability 1 of 5
- Financial health 3 of 5
- Dividend 0 of 5
Statements to Sep 30, 2026.
Financials — quick view
MTEX Revenue — quarterly 24.87M
MTEX Net income — quarterly 8.90M
MTEX EPS — quarterly 4.61
Earnings
| Report date | Quarter ending | EPS estimate | EPS reported | Surprise | Surprise % |
|---|---|---|---|---|---|
| Nov 12, 2024 | Sep 1, 2024 | 0.00 | -0.17 | — | — |
| Aug 13, 2024 | Jun 1, 2024 | 0.00 | -0.33 | — | — |
| May 14, 2024 | Mar 1, 2024 | 0.00 | 0.63 | — | — |
| Mar 28, 2024 | Dec 1, 2023 | 0.00 | -0.94 | — | — |
| Nov 7, 2023 | Sep 1, 2023 | 0.00 | 0.01 | — | — |
| Aug 14, 2023 | Jun 1, 2023 | 0.00 | -0.59 | — | — |
About Mannatech, Incorporated
Mannatech, Incorporated operates as a health and wellness company in the Americas, Europe, the Middle East, Africa, and the Asia-Pacific. The company develops, markets, and sells nutritional supplements; topical and skin care, and anti-aging products; and weight-management and fitness products. It primarily sells its products directly, as well as through e-commerce and network marketing channels. Mannatech, Incorporated was incorporated in 1993 and is headquartered in Flower Mound, Texas.
- Sector
- Consumer Defensive
- Industry
- Food Distribution
- Country
- United States
- Website
- mannatech.com
News
 Mannatech Q3 EPS $4.61 Up From $1.01 YoY, Sales $24.872M Down From $29.161M YoY
 Mannatech Reports Financial Results for Third Quarter 2026
 Mannatech Announces Retirement of J. Stanley Fredrick from the Board and Appointment of Robert Toth as Chairman of the Board
 Mannatech Reports Financial Results for Second Quarter 2026
 Mannatech (NASDAQ:MTEX) Share Price Passes Below 200 Day Moving Average – Here’s What Happened
 Mannatech Announces Appointment of Yasir Haider as Chief Financial Officer
 Mannatech Announces Results of Annual Shareholders' Meeting
 Mannatech Reports Financial Results for First Quarter 2026
 Mannatech Reports Financial Results for Fourth Quarter and Year Ended 2025
 Mannatech (NASDAQ:MTEX) Stock Crosses Below Two Hundred Day Moving Average – Should You Sell?
Your note
Sign in to keep a note on MTEX — it syncs with the Stock Master app.
Insider holders
| Insider | Relation | Latest transaction | Date | Shares held |
|---|---|---|---|---|
| BALA ALFREDO | Chief Executive Officer | Sale | Aug 29, 2023 | 3,137 |
| FREDRICK J. STANLEY | Director | Stock Award(Grant) | Jan 1, 2024 | 354,289 |
| FREDRICK LANDEN GRANVEL | Chief Operating Officer | Stock Award(Grant) | Mar 10, 2024 | 12,162 |
| JOBE LARRY A | Director | Sale | Sep 8, 2024 | 54,721 |
| JOHN SEIFRICK A | Director | Stock Award(Grant) | Jan 1, 2024 | 6,270 |
| RAMESON TYLER J | Director | Purchase | Sep 8, 2024 | 299,197 |
Institution ownership
| Holder | % held | Shares | Value | Reported |
|---|---|---|---|---|
| Blackrock Inc. | 2.78% | 52,404 | 607.10K | Sep 29, 2024 |
| Bridgeway Capital Management, Inc. | 2.47% | 46,614 | 540.02K | Sep 29, 2024 |
| Vanguard Group Inc | 2.06% | 38,762 | 449.06K | Sep 29, 2024 |
| Acadian Asset Management. LLC | 1.91% | 36,073 | 417.90K | Sep 29, 2024 |
| Renaissance Technologies, LLC | 1.81% | 34,078 | 394.79K | Sep 29, 2024 |
| IFG Advisory, LLC | 1.01% | 19,090 | 221.16K | Sep 29, 2024 |
Fund ownership
| Holder | % held | Shares | Value | Reported |
|---|---|---|---|---|
| Vanguard Total Stock Market Index Fund | 1.64% | 30,953 | 358.59K | Sep 29, 2024 |
| Bridgeway Funds Inc-Ultra Small Company Fund | 1.24% | 23,388 | 270.95K | Sep 29, 2024 |
| Bridgeway Fds Inc-Omni Small Cap Value Fund | 0.44% | 8,378 | 97.06K | Sep 29, 2024 |
| Bridgeway Funds Inc-Ultra Small Company Market Fund | 0.44% | 8,298 | 96.13K | Sep 29, 2024 |
| Vanguard Extended Market Index Fund | 0.40% | 7,559 | 87.57K | Sep 29, 2024 |
| EA Series Trust-EA Bridgeway Omni Small-Cap Value ETF | 0.30% | 5,650 | 65.45K | Sep 29, 2024 |