

Morgan Stanley MS
As ofNov 18, 2026, 2:40 PM EST
- YTD
- +1.80%
- 1 year
- +13.07%
- Market cap
- 282.52B
- Revenue (ttm)
- 79.79B
- Profit margin
- 25.63%
- EPS (ttm)
- 12.61
- Shares out
- 1.56B
- P/E ratio
- 14.33
- Forward P/E
- 13.42
- Dividend
- 4.60 (2.43%)
- Ex-dividend date
- Oct 30, 2026
- YTD return
- +1.80%
- 1-year return
- +13.07%
- Volume
- 2.88M
- Avg volume
- 5.60M
- Open
- 182.68
- Previous close
- 183.53
- Day's range
- 180.10 – 183.59
- 52-week range
- 154.37 – 228.55
- Beta
- 1.22
- Analysts
- Buy
- Price target
- 211.50 (+17.0%)
- Earnings date
- Jan 14, 2027
- 50-day average
- 192.08
5D -9.24 (-4.86%)
Key statistics
- 200-day average
- 194.53
- Enterprise value
- 113.09B
- PEG ratio
- 1.61
- Price / sales
- 3.59
- Price / book
- 2.68
- Payout ratio
- 32.91%
- Revenue growth
- 10.80%
- Total cash
- 767.41B
- Total debt
- 579.49B
- Return on equity
- 18.04%
Fundamental scorecard
15 of 25 checks passed on MS’s reported financials
15of 25 checks passed
- Value 2 of 5
- Growth 5 of 5
- Profitability 4 of 5
- Financial health No data
- Dividend 4 of 5
Statements to Sep 30, 2026.
Analyst view
Consensus: buy
- Target (low)
- 185.00
- Target (mean)
- 211.50
- Target (high)
- 262.00
- Strong buy2
- Buy9
- Hold14
- Sell1
- Strong sell0
Next earnings
Jan 14, 2027
Expected Jan 14, 2027. Consensus EPS estimate 2.97.
Financials — quick view
Earnings
| Report date | Quarter ending | EPS estimate | EPS reported | Surprise | Surprise % |
|---|---|---|---|---|---|
| Jan 14, 2027 | Dec 30, 2026 | 2.93 | — | — | — |
| Oct 14, 2026 | Sep 30, 2026 | 2.93 | 3.03 | +0.10 | +3.41% |
| Jul 15, 2026 | Jun 30, 2026 | 2.93 | 3.46 | +0.53 | +18.09% |
| Apr 15, 2026 | Mar 31, 2026 | 3.02 | 3.43 | +0.41 | +13.58% |
| Jan 15, 2026 | Dec 31, 2025 | 2.43 | 2.68 | +0.25 | +10.29% |
| Oct 15, 2025 | Sep 30, 2025 | 2.10 | 2.80 | +0.70 | +33.33% |
Upgrades / downgrades
| Date | Firm | Action | From | To |
|---|---|---|---|---|
| Nov 2, 2026 | UBS | main | Buy | Buy |
| Oct 19, 2026 | BMO Capital | main | Outperform | Outperform |
| Oct 16, 2026 | JP Morgan | main | Neutral | Neutral |
| Oct 15, 2026 | Citigroup | main | Neutral | Neutral |
| Oct 15, 2026 | RBC Capital | main | Sector Perform | Sector Perform |
| Oct 15, 2026 | TD Cowen | main | Hold | Hold |
About Morgan Stanley
Morgan Stanley, a financial holding company, provides various financial products and services to corporations, governments, financial institutions, and individuals in the Americas, Asia, Europe, the Middle East, and Africa. It operates through Institutional Securities, Wealth Management, and Investment Management segments. The company offers capital raising and financial advisory services, including services related to the underwriting of debt, equity securities, and other products, as well as advice on mergers and acquisitions, restructurings, and project finance. It also provides equity and fixed income products comprising sales, financing, prime brokerage, and market-making services; Asia wealth management; business-related investments services; originating corporate and commercial real estate loans, secured lending facilities, and extending securities-based and other financing; and research activities. In addition, the company offers financial advisor-led brokerage, investment advisory, custody, cash management, and administrative services; self-directed brokerage services; financial and wealth planning services; stock plan administration; securities-based lending, residential real estate loans, and other lending products; banking; and retirement plan services. Further, it provides equity, fixed income, alternatives and solutions, and liquidity and overlay services to benefit/defined contribution plans, foundations, endowments, government entities, sovereign wealth funds, insurance companies, third-party fund sponsors, corporations, and individuals. Morgan Stanley was founded in 1924 and is headquartered in New York, New York.
- Sector
- Financial Services
- Industry
- Capital Markets
- Country
- United States
- Website
- morganstanley.com
News
 Will Morgan Stanley's European ETF Launch Unlock New Growth Prospects?
 XRP Eyes $1 Recovery as Major Banks Disclose ETF Holdings
 Wall Street Giants Loaded Up on Bitcoin Before 20% Crash—What Now?
 Bank of America vs. JPMorgan Chase: Which Financial Stock Is a Better Buy for 2027?
 Morgan Stanley Investment Management Launches Active ETF Platform in Europe
 5 Financials Stocks With Whale Alerts In Today’s Session
 Hedge Funds Are Dumping Leverage at a Pace Last Seen in March 2020. A 63-Year-Old Who Moved His 401(k) to Cash Then Would Have Missed a 51.5% Rally. Here’s the Math
 Morgan Stanley Preferreds: Series O Now Yields Over ~7% At A Significant Discount To Par
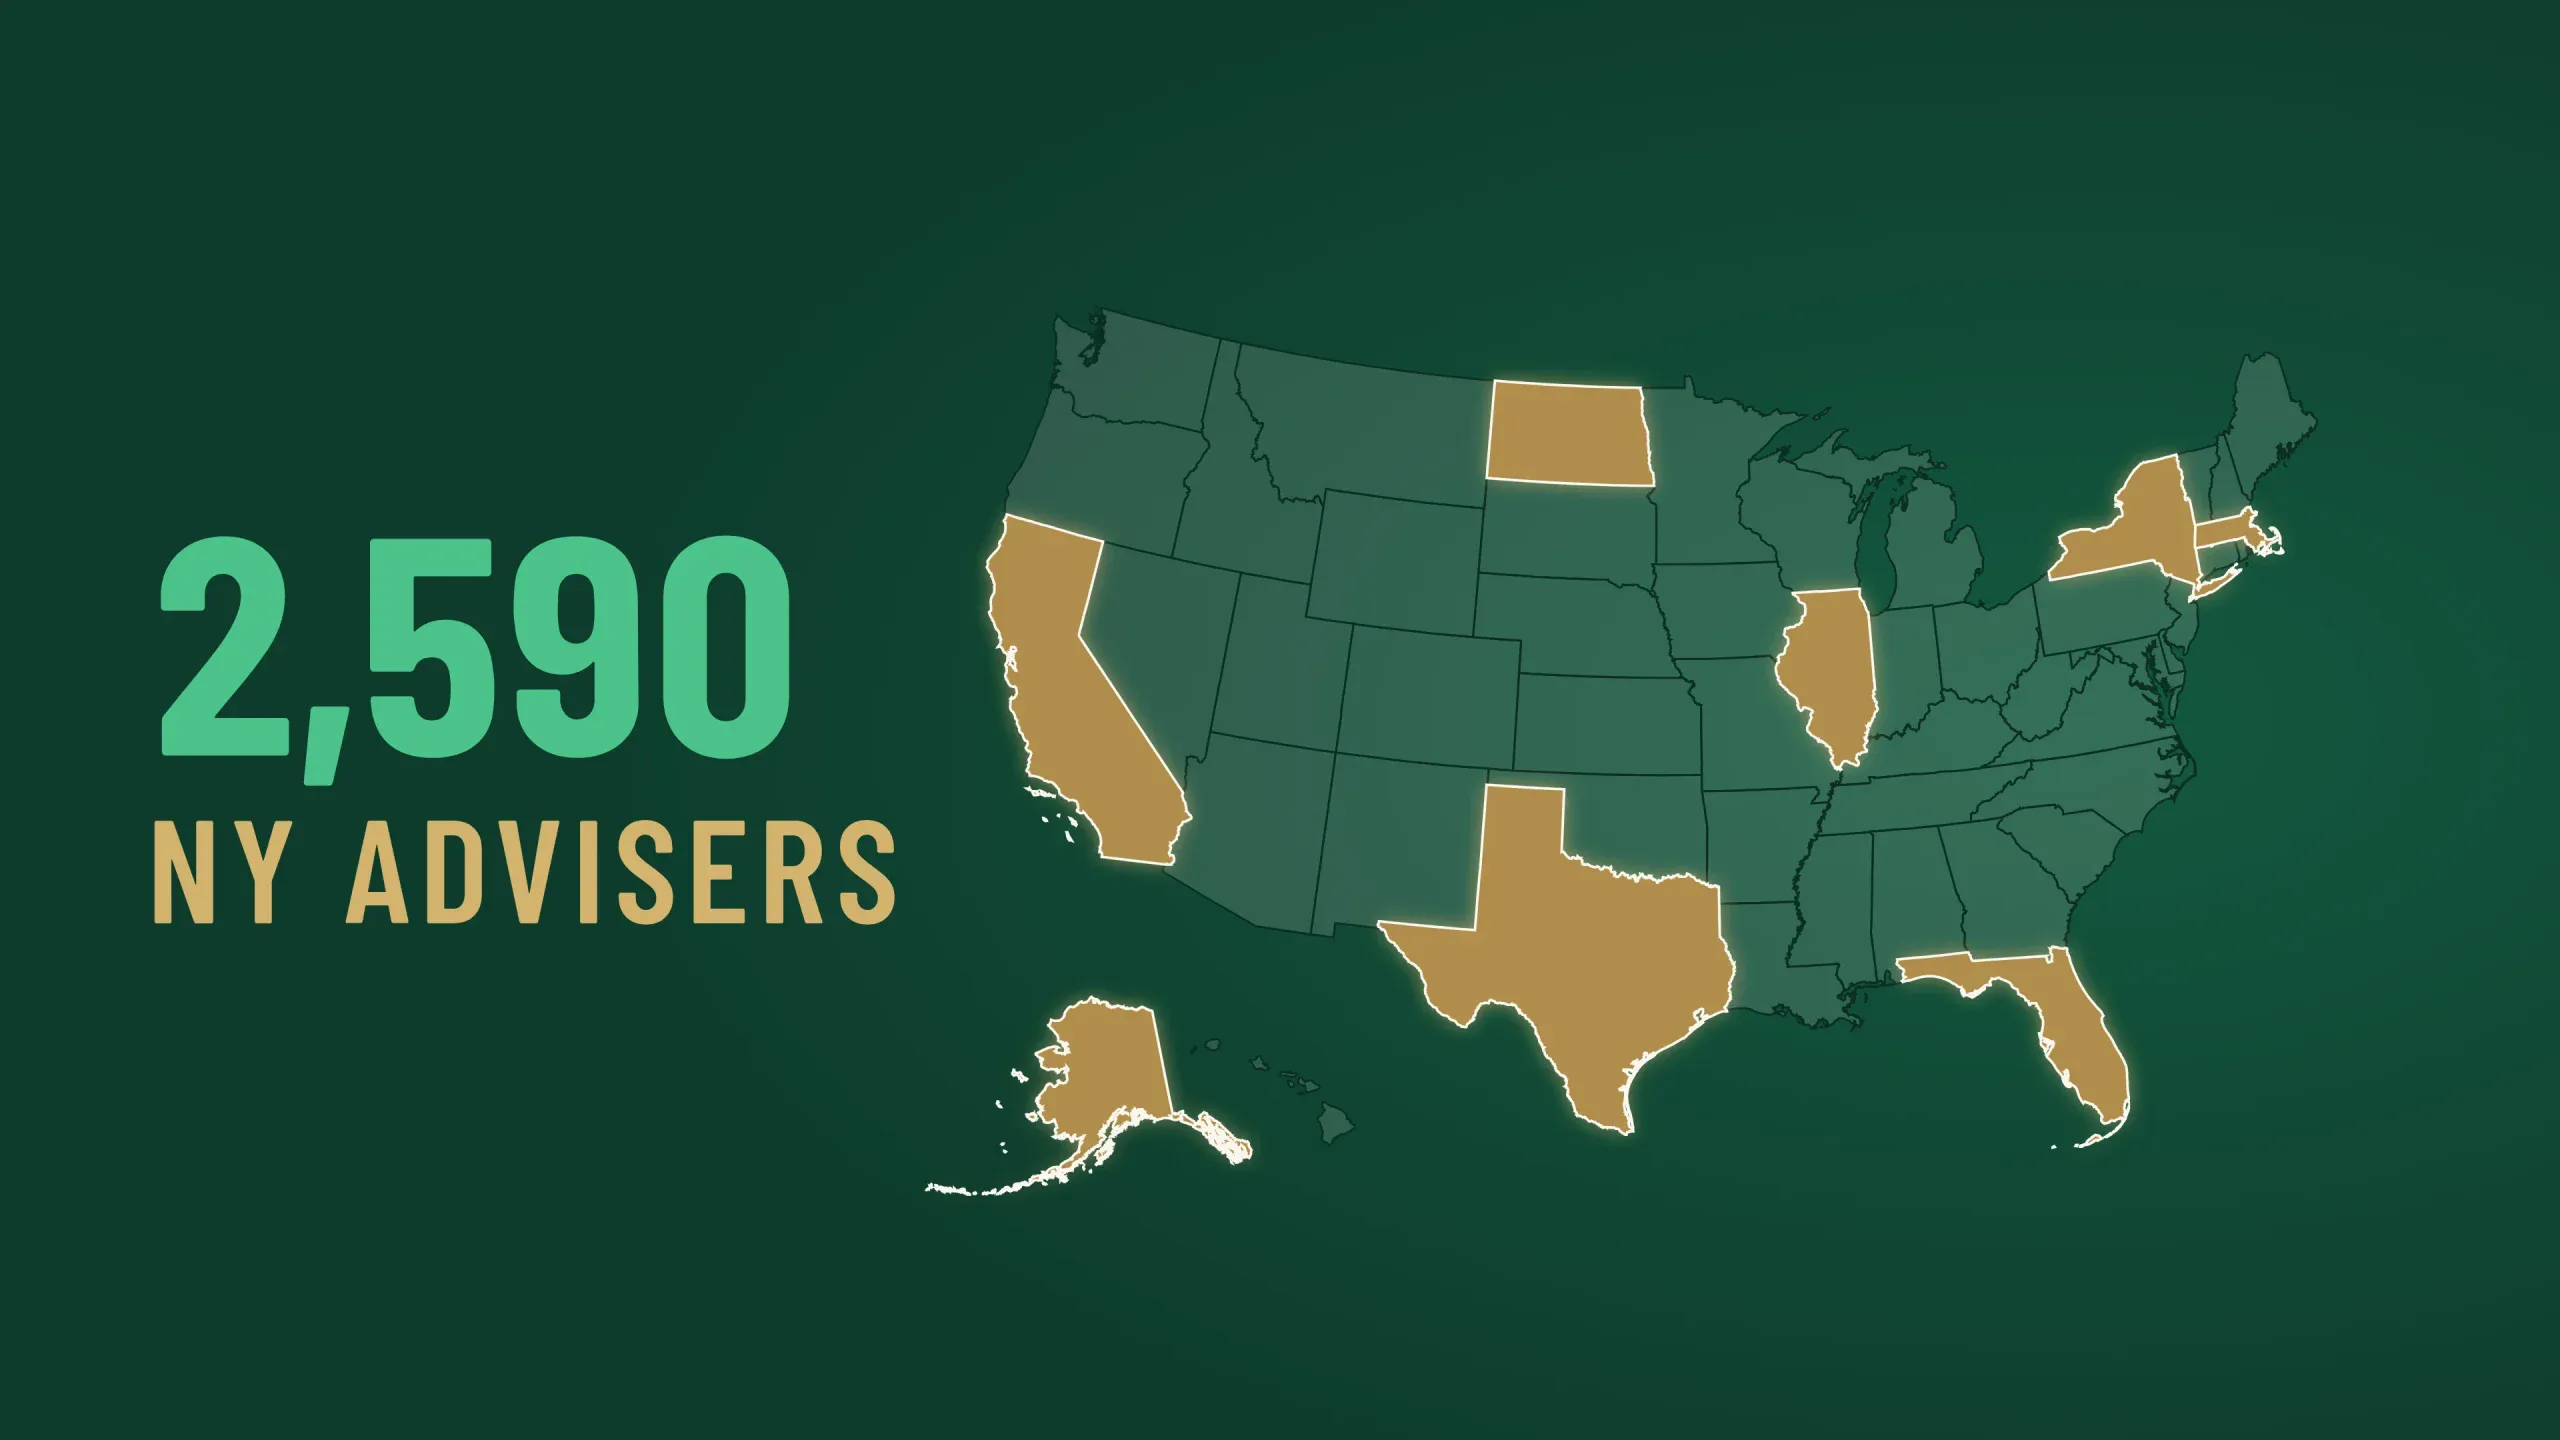 New York Has 2,590 SEC-Registered Investment Advisers, the Most of Any State. North Dakota and Alaska Have 9 Each
 Morgan Stanley $MS Shares Bought by Allworth Financial LP
Your note
Sign in to keep a note on MS — it syncs with the Stock Master app.
Insider holders
| Insider | Relation | Latest transaction | Date | Shares held |
|---|---|---|---|---|
| GLOCER THOMAS HENRY | Director | Stock Award(Grant) | May 31, 2026 | 124,550 |
| GROSSMAN ERIC F | Officer | Sale | Apr 19, 2026 | 169,403 |
| HERZ ROBERT H | Director | Stock Award(Grant) | May 31, 2026 | 102,563 |
| LUCZO STEPHEN JAMES | Director | Stock Award(Grant) | Dec 30, 2024 | 189,706 |
| PICK EDWARD N. | Chief Executive Officer | Stock Award(Grant) | Mar 11, 2026 | 775,510 |
| PIZZI MICHAEL A | Officer | Sale | Jul 16, 2026 | 121,770 |
Institution ownership
| Holder | % held | Shares | Value | Reported |
|---|---|---|---|---|
| Mitsubishi UFJ Financial Group Inc | 24.01% | 375,330,252 | 68.87B | Sep 29, 2026 |
| State Street Corporation | 6.37% | 99,592,731 | 18.27B | Sep 29, 2026 |
| Blackrock Inc. | 6.11% | 95,562,827 | 17.53B | Sep 29, 2026 |
| Vanguard Capital Management LLC | 4.96% | 77,536,977 | 14.23B | Sep 29, 2026 |
| JPMORGAN CHASE & CO | 2.22% | 34,656,739 | 6.36B | Sep 29, 2026 |
| Vanguard Portfolio Management LLC | 1.99% | 31,085,148 | 5.70B | Sep 29, 2026 |
Fund ownership
| Holder | % held | Shares | Value | Reported |
|---|---|---|---|---|
| VANGUARD INDEX FUNDS-Vanguard Total Stock Market Index Fund | 2.40% | 37,554,216 | 6.89B | Jun 29, 2026 |
| VANGUARD INDEX FUNDS-Vanguard 500 Index Fund | 1.99% | 31,062,993 | 5.70B | Jun 29, 2026 |
| iShares Trust-iShares Core S&P 500 ETF | 1.02% | 15,904,920 | 2.92B | Sep 29, 2026 |
| Fidelity Concord Street Trust-Fidelity 500 Index Fund | 0.99% | 15,512,370 | 2.85B | Sep 29, 2026 |
| SPDR S&P 500 ETF TRUST-State Street SPDR S&P 500 ETF Trust | 0.94% | 14,760,561 | 2.71B | Sep 29, 2026 |
| VANGUARD INDEX FUNDS-Vanguard Value Index Fund | 0.72% | 11,261,843 | 2.07B | Jun 29, 2026 |