

Citigroup Inc. C
At closeNov 12, 2026, 6:56 PM EST
After hours · Nov 12, 6:56 PM ET
- YTD
- +6.32%
- 1 year
- +20.60%
- Market cap
- 205.34B
- Revenue (ttm)
- 83.30B
- Profit margin
- 23.21%
- EPS (ttm)
- 10.26
- Shares out
- 1.66B
- P/E ratio
- 12.09
- Forward P/E
- 9.50
- Dividend
- 2.68 (2.19%)
- Ex-dividend date
- Nov 1, 2026
- YTD return
- +6.32%
- 1-year return
- +20.60%
- Volume
- 6.06M
- Avg volume
- 9.51M
- Open
- 124.08
- Previous close
- 124.21
- Day's range
- 123.39 – 125.19
- 52-week range
- 95.83 – 147.96
- Beta
- 1.15
- Analysts
- Buy
- Price target
- 150.60 (+21.4%)
- Earnings date
- Jan 14, 2027
5D +5.58 (+4.71%)
Key statistics
- Enterprise value
- -57.93B
- PEG ratio
- 0.52
- Price / sales
- 2.47
- Price / book
- 1.07
- Dividend yield
- 2.16%
- Payout ratio
- 24.07%
- Revenue growth
- 8.00%
- Free cash flow
- 0
- Total cash
- 1.17T
- Total debt
- 888.90B
- Return on equity
- 9.35%
- Short % of float
- 0.05%
- 50-day average
- 128.34
- 200-day average
- 126.85
Analyst view
Consensus: buy
- Target (low)
- 127.00
- Target (mean)
- 150.60
- Target (high)
- 170.00
- Strong buy5
- Buy13
- Hold5
- Sell0
- Strong sell0
Next earnings
Jan 14, 2027
Expected Jan 14, 2027. Consensus EPS estimate 2.30.
Financials — quick view
Earnings
| Report date | Quarter ending | EPS estimate | EPS reported | Surprise | Surprise % |
|---|---|---|---|---|---|
| Jan 14, 2027 | Dec 30, 2026 | 2.34 | — | — | — |
| Oct 13, 2026 | Sep 30, 2026 | 2.66 | 2.85 | +0.19 | +7.14% |
| Jul 14, 2026 | Jun 30, 2026 | 2.74 | 3.15 | +0.41 | +14.96% |
| Apr 14, 2026 | Mar 31, 2026 | 2.65 | 3.06 | +0.41 | +15.47% |
| Jan 21, 2026 | Dec 31, 2025 | 1.80 | 1.19 | -0.61 | -33.89% |
| Nov 6, 2025 | Sep 30, 2025 | 1.73 | 1.86 | +0.13 | +7.51% |
Upgrades / downgrades
| Date | Firm | Action | From | To |
|---|---|---|---|---|
| Oct 30, 2026 | JP Morgan | main | Overweight | Overweight |
| Oct 14, 2026 | Evercore ISI Group | main | In-Line | In-Line |
| Oct 14, 2026 | TD Cowen | main | Buy | Buy |
| Oct 14, 2026 | RBC Capital | main | Outperform | Outperform |
| Oct 5, 2026 | UBS | main | Neutral | Neutral |
| Oct 2, 2026 | JP Morgan | main | Overweight | Overweight |
About Citigroup Inc.
Citigroup Inc., a diversified financial service holding company, provides various financial products and services to consumers, corporations, governments, and institutions. It operates through five segments: Services, Markets, Banking, U.S. Personal Banking, and Wealth. The Services segment includes treasury and trade solutions, which provides cash management, trade, and working capital solutions to multinational corporations, financial institutions, and public sector organizations; and securities services, such as cross-border support for clients, local market expertise, post-trade technologies, data solutions, and various securities services solutions. The Markets segment offers sales and trading services for equities, foreign exchange, rates, spread products, and commodities to corporate, institutional, and public sector clients; and market-making services, including asset classes, risk management solutions, financing, and prime brokerage. The Banking segment includes investment banking services comprising equity and debt capital markets-related strategic financing solutions; advisory services related to mergers and acquisitions, divestitures, restructurings, and corporate defense activities; and corporate lending consists of corporate and commercial banking. The U.S. Personal Banking segment provides proprietary and co-branded card portfolios; and traditional banking services to retail and small business customers. The Wealth segment offers financial services to high-net-worth clients through banking, lending, mortgages, investment, custody, and trust product offerings; professional industries, including law firms, consulting groups, accounting, and asset management; and affluent and high net worth clients. The company operates in North America, the United Kingdom, Japan, North and South Asia, Australia, Europe, the Middle East, and Africa. Citigroup Inc. was founded in 1812 and is headquartered in New York, New York.
- Sector
- Financial Services
- Industry
- Banks - Diversified
- Country
- United States
- Website
- citigroup.com
News
 C Trades at a Discount to Industry: Right Time to Buy the Stock?
 As Jensen Huang leaves Nvidia, Citigroup Lowers Its Price Target on the Stock From $285 to $225. Does That Make Sense?
 Crypto Market Today, Nov. 11: 2. Bitcoin Climbs Back Above $74,000 as Wall Street's Crypto Outlook Begins to Shift
 Citigroup Bets on Cards and AI as Consumer Spending Climbs 11%
 BILL Holdings, Inc. (BILL) Presents at Citi's 15th Annual FinTech Conference Transcript
 Goldman Sachs, Citi Back $270M Stablecoin Venture to Challenge Tether, Circle
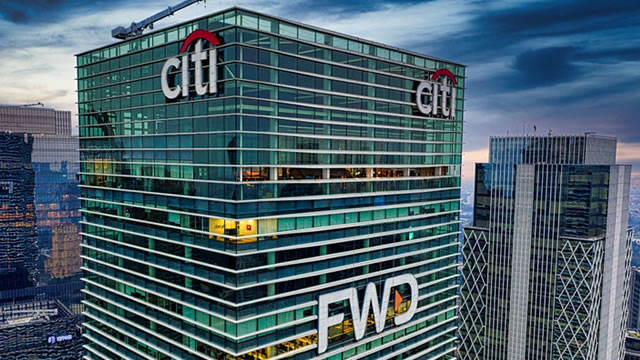 Citi's Fraser: China License Gives Bank Edge on Rivals
 Citigroup Announces Full Redemption of Series Y Preferred Stock
 Morgan Stanley Climbs 4% on Vinyl Equity Deal to Capture IPO Wealth; Goldman Sachs Rises 5%, JPMorgan Gains 2%
 Citigroup's Jane Fraser Says Hedge Funds Drove the Sell-Off. Here's Why She Doesn't Expect It to Get Worse
Your note
Sign in to keep a note on C — it syncs with the Stock Master app.
Insider holders
| Insider | Relation | Latest transaction | Date | Shares held |
|---|---|---|---|---|
| CANTU ERNESTO TORRES | Officer | Sale | Feb 12, 2026 | 0 |
| FRASER JANE NIND | Chief Executive Officer | Stock Award(Grant) | Feb 10, 2026 | 935,831 |
| LIVINGSTONE DAVID | Officer | Stock Award(Grant) | Feb 10, 2026 | 456,001 |
| MASON MARK A.L. | Chief Financial Officer | Sale | Feb 19, 2026 | 234,138 |
| MORTON ANDREW JOHN | Officer | Stock Award(Grant) | Feb 10, 2026 | 461,140 |
| RAGHAVAN VISWAS | Officer | Stock Award(Grant) | Feb 10, 2026 | 628,759 |
Institution ownership
| Holder | % held | Shares | Value | Reported |
|---|---|---|---|---|
| Blackrock Inc. | 8.77% | 149,509,189 | 18.55B | Jun 29, 2026 |
| Vanguard Capital Management LLC | 6.29% | 107,230,182 | 13.31B | Jun 29, 2026 |
| State Street Corporation | 4.57% | 77,908,419 | 9.67B | Jun 29, 2026 |
| Geode Capital Management, LLC | 2.42% | 41,305,100 | 5.13B | Sep 29, 2026 |
| Fisher Asset Management, LLC | 2.18% | 37,172,713 | 4.61B | Sep 29, 2026 |
| Franklin Resources, Inc. | 2.11% | 36,014,050 | 4.47B | Jun 29, 2026 |
Fund ownership
| Holder | % held | Shares | Value | Reported |
|---|---|---|---|---|
| VANGUARD INDEX FUNDS-Vanguard Total Stock Market Index Fund | 2.92% | 49,840,401 | 6.18B | Jun 29, 2026 |
| VANGUARD INDEX FUNDS-Vanguard 500 Index Fund | 2.38% | 40,655,858 | 5.04B | Jun 29, 2026 |
| iShares Trust-iShares Core S&P 500 ETF | 1.31% | 22,351,147 | 2.77B | Sep 29, 2026 |
| Fidelity Concord Street Trust-Fidelity 500 Index Fund | 1.28% | 21,799,888 | 2.70B | Sep 29, 2026 |
| SPDR S&P 500 ETF TRUST-State Street SPDR S&P 500 ETF Trust | 1.22% | 20,742,409 | 2.57B | Sep 29, 2026 |
| VANGUARD INDEX FUNDS-Vanguard Value Index Fund | 0.90% | 15,394,972 | 1.91B | Jun 29, 2026 |