

Johnson & Johnson JNJ
At closeNov 10, 2026, 7:12 AM EST
Pre-market · Nov 10, 7:12 AM ET
- YTD
- +36.32%
- 1 year
- +49.73%
- Market cap
- 679.13B
- Revenue (ttm)
- 99.33B
- Profit margin
- 16.20%
- EPS (ttm)
- 6.59
- Shares out
- 2.41B
- P/E ratio
- 42.81
- Forward P/E
- 24.28
- Dividend
- 5.36 (1.98%)
- Ex-dividend date
- Nov 23, 2026
- YTD return
- +36.32%
- 1-year return
- +49.73%
- Volume
- 6.90M
- Avg volume
- 6.97M
- Open
- 278.00
- Previous close
- 276.22
- Day's range
- 276.20 – 282.73
- 52-week range
- 189.05 – 282.73
- Beta
- 0.20
- Analysts
- Buy
- Price target
- 279.41 (-1.0%)
- Earnings date
- Jan 26, 2027
5D +12.60 (+4.68%)
Key statistics
- Enterprise value
- 692.37B
- PEG ratio
- 3.11
- Price / sales
- 6.84
- Price / book
- 8.33
- Dividend yield
- 1.94%
- Payout ratio
- 80.12%
- Revenue growth
- 5.90%
- Free cash flow
- 18.50B
- Total cash
- 17.23B
- Total debt
- 44.65B
- Return on equity
- 20.02%
- Short % of float
- 0.78%
- 50-day average
- 265.79
- 200-day average
- 248.33
Analyst view
Consensus: buy
- Target (low)
- 190.00
- Target (mean)
- 279.41
- Target (high)
- 320.00
- Strong buy5
- Buy11
- Hold6
- Sell1
- Strong sell0
Next earnings
Jan 26, 2027
Expected Jan 26, 2027. Consensus EPS estimate 2.92.
Financials — quick view
Earnings
| Report date | Quarter ending | EPS estimate | EPS reported | Surprise | Surprise % |
|---|---|---|---|---|---|
| Jan 26, 2027 | Dec 27, 2026 | 2.91 | — | — | — |
| Oct 13, 2026 | Sep 27, 2026 | 2.52 | 2.59 | +0.07 | +2.78% |
| Jul 15, 2026 | Jun 28, 2026 | 2.85 | 2.90 | +0.05 | +1.75% |
| Apr 14, 2026 | Mar 29, 2026 | 2.68 | 2.70 | +0.02 | +0.75% |
| Jan 21, 2026 | Dec 28, 2025 | 2.46 | 2.46 | 0.00 | 0.00% |
| Oct 14, 2025 | Sep 28, 2025 | 2.76 | 2.80 | +0.04 | +1.45% |
Upgrades / downgrades
| Date | Firm | Action | From | To |
|---|---|---|---|---|
| Oct 16, 2026 | Wells Fargo | main | Overweight | Overweight |
| Oct 15, 2026 | Morgan Stanley | main | Overweight | Overweight |
| Oct 14, 2026 | Leerink Partners | main | Outperform | Outperform |
| Oct 14, 2026 | Wells Fargo | main | Overweight | Overweight |
| Oct 14, 2026 | RBC Capital | main | Outperform | Outperform |
| Oct 7, 2026 | Guggenheim | reit | Buy | Buy |
About Johnson & Johnson
Johnson & Johnson, together with its subsidiaries, engages in the research and development, manufacture, and sale of a range of products in the healthcare field worldwide. It operates in two segments, Innovative Medicine and MedTech. The Innovative Medicine segment offers products for various therapeutic areas, such as oncology, immunology, neuroscience, pulmonary hypertension, infectious diseases, and cardiovascular and metabolism distributed through retailers, wholesalers, distributors, hospitals, and healthcare professionals for prescription use. The MedTech segment provides a portfolio of products used in the surgery, orthopedic, cardiovascular, and vision fields distributed through wholesalers, hospitals and retailers, and used in the professional fields by physicians, nurses, hospitals, eye care professionals and clinics. This segment also offers products and enabling technologies that support joint reconstruction, trauma, spine, sports related injuries, and others, as well as open, laparoscopic, and robotic surgical procedures; instrumentation, energy devices, stapling systems, wound closure, biosurgery products, and digital and robotic technologies; breast aesthetics and reconstruction; contact lenses under the ACUVUE brand; intraocular lenses for cataract surgery, and other products used in cataract and refractive procedures under the TECNIS brand. The company was founded in 1886 and is based in New Brunswick, New Jersey.
- Sector
- Healthcare
- Industry
- Drug Manufacturers - General
- Country
- United States
- Website
- jnj.com
News
 Johnson & Johnson $JNJ Stock Acquired by AlphaCore Capital LLC
 Hims-Eli Lilly GLP-1 Deal Meets Summit’s FDA Gamble: Which Biotech ETFs Stand to Gain?
 11 Of 11 Sectors Rise Monday As Growth Leads
 Johnson & Johnson Showcases Positive Trial Data For Key Autoimmune Therapies
 Reported Saturday, Johnson & Johnson Reports 57% Of Psoriatic Arthritis Patients With Qualifying Skin Involvement On ICOTYDE Achieved Clear Or Almost Clear Skin Versus 14% On Placebo, Alongside 58% ACR20 Response At Week 16
 Reported Saturday, Johnson & Johnson Says Patient Insights From Phase 2 DAHLIAS Study Helped Inform Phase 3 Nipocalimab Design, With 73.5% Of Interviewed Patients Satisfied Or Very Satisfied With Treatment In Sjögren’s Disease
 Reported Sunday, Johnson & Johnson Says Pasritamig And JNJ-9401 Achieve 73% PSA Response With No Grade 3 Or Higher Treatment-Related Adverse Events In Phase 1 Prostate Cancer Study, Supporting Outpatient Dosing
 Johnson & Johnson announces new Phase 2 nipocalimab study data in Sjögren's disease that reveal insights on importance of symptom improvements most valued by patients
 Johnson & Johnson announces ICOTYDE® (icotrokinra) delivers significant improvement in psoriatic arthritis disease activity among biologic-naive patients with once-daily targeted oral peptide
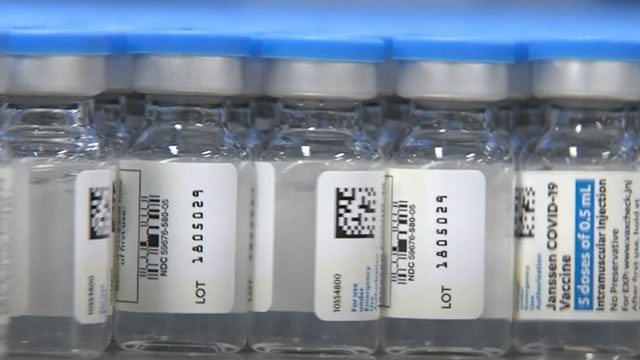 J&J's once-daily pill eases psoriatic arthritis symptoms in late-stage trial
Your note
Sign in to keep a note on JNJ — it syncs with the Stock Master app.
Insider holders
| Insider | Relation | Latest transaction | Date | Shares held |
|---|---|---|---|---|
| BROADHURST VANESSA | Officer | Conversion of Exercise of derivative security | Jul 19, 2026 | 23,003 |
| DECKER ROBERT J | Officer | Conversion of Exercise of derivative security | Feb 26, 2026 | 24,462 |
| DUATO JOAQUIN BOIX | Chief Executive Officer | Conversion of Exercise of derivative security | Aug 12, 2026 | 307,837 |
| MULHOLLAND KRISTEN | Officer | Conversion of Exercise of derivative security | Feb 12, 2026 | 19,830 |
| REED JOHN C | Officer | Conversion of Exercise of derivative security | Apr 30, 2026 | 24,911 |
| SCHMID TIMOTHY | Officer | Conversion of Exercise of derivative security | Sep 1, 2026 | 26,251 |
Institution ownership
| Holder | % held | Shares | Value | Reported |
|---|---|---|---|---|
| Blackrock Inc. | 8.81% | 212,098,264 | 59.83B | Jun 29, 2026 |
| Vanguard Capital Management LLC | 6.53% | 157,226,374 | 44.35B | Jun 29, 2026 |
| State Street Corporation | 5.56% | 133,776,025 | 37.74B | Jun 29, 2026 |
| Geode Capital Management, LLC | 2.72% | 65,497,363 | 18.48B | Sep 29, 2026 |
| Vanguard Portfolio Management LLC | 2.67% | 64,370,816 | 18.16B | Jun 29, 2026 |
| JPMORGAN CHASE & CO | 2.42% | 58,301,609 | 16.45B | Jun 29, 2026 |
Fund ownership
| Holder | % held | Shares | Value | Reported |
|---|---|---|---|---|
| VANGUARD INDEX FUNDS-Vanguard Total Stock Market Index Fund | 3.17% | 76,421,624 | 21.56B | Jun 29, 2026 |
| VANGUARD INDEX FUNDS-Vanguard 500 Index Fund | 2.59% | 62,378,802 | 17.60B | Jun 29, 2026 |
| iShares Trust-iShares Core S&P 500 ETF | 1.33% | 32,111,390 | 9.06B | Sep 29, 2026 |
| Fidelity Concord Street Trust-Fidelity 500 Index Fund | 1.30% | 31,318,950 | 8.83B | Sep 29, 2026 |
| SPDR S&P 500 ETF TRUST-State Street SPDR S&P 500 ETF Trust | 1.24% | 29,810,722 | 8.41B | Sep 29, 2026 |
| VANGUARD INDEX FUNDS-Vanguard Value Index Fund | 0.95% | 22,911,023 | 6.46B | Jun 29, 2026 |