

Huntington Bancshares Incorporated HBAN
Regular-session close
Pre-market · Nov 18, 4:01 AM ET
- YTD
- -12.39%
- 1 year
- -0.65%
- Market cap
- 30.63B
- Revenue (ttm)
- 9.82B
- Profit margin
- 25.37%
- EPS (ttm)
- 1.22
- Shares out
- 2.02B
- P/E ratio
- 12.46
- Forward P/E
- 8.69
- Dividend
- 0.62 (3.97%)
- Ex-dividend date
- Dec 18, 2026
- YTD return
- -12.39%
- 1-year return
- -0.65%
- Volume
- 23.68M
- Avg volume
- 24.38M
- Open
- 15.61
- Previous close
- 15.63
- Day's range
- 15.16 – 15.68
- 52-week range
- 14.82 – 19.46
- Beta
- 0.98
- Analysts
- Buy
- Price target
- 18.78 (+23.5%)
- Earnings date
- Jan 28, 2027
- 50-day average
- 15.72
5D -0.60 (-3.80%)
Key statistics
- 200-day average
- 16.59
- Enterprise value
- 40.93B
- PEG ratio
- 1.87
- Price / sales
- 3.12
- Price / book
- 1.05
- Payout ratio
- 50.82%
- Revenue growth
- 32.20%
- Total cash
- 18.24B
- Total debt
- 24.75B
- Return on equity
- 9.19%
- Short % of float
- 2.92%
Fundamental scorecard
13 of 25 checks passed on HBAN’s reported financials
13of 25 checks passed
- Value 3 of 5
- Growth 4 of 5
- Profitability 2 of 5
- Financial health No data
- Dividend 4 of 5
Statements to Sep 30, 2026.
Analyst view
Consensus: buy
- Target (low)
- 17.00
- Target (mean)
- 18.78
- Target (high)
- 22.50
- Strong buy3
- Buy11
- Hold7
- Sell0
- Strong sell0
Next earnings
Jan 28, 2027
Expected Jan 28, 2027. Consensus EPS estimate 0.39709.
Financials — quick view
Earnings
| Report date | Quarter ending | EPS estimate | EPS reported | Surprise | Surprise % |
|---|---|---|---|---|---|
| Jan 28, 2027 | Dec 30, 2026 | 0.41 | — | — | — |
| Oct 22, 2026 | Sep 30, 2026 | 0.3483 | 0.38 | +0.03 | +9.10% |
| Jul 23, 2026 | Jun 30, 2026 | 0.3586 | 0.33 | -0.03 | -7.98% |
| Apr 23, 2026 | Mar 31, 2026 | 0.2282 | 0.25 | +0.02 | +9.55% |
| Jan 22, 2026 | Dec 31, 2025 | 0.3309 | 0.31 | -0.02 | -6.32% |
| Oct 17, 2025 | Sep 30, 2025 | 0.3745 | 0.40 | +0.03 | +6.81% |
Upgrades / downgrades
| Date | Firm | Action | From | To |
|---|---|---|---|---|
| Nov 5, 2026 | Argus Research | main | Buy | Buy |
| Oct 30, 2026 | JP Morgan | main | Overweight | Overweight |
| Oct 28, 2026 | Truist Securities | main | Buy | Buy |
| Oct 27, 2026 | Wolfe Research | down | Outperform | Peer Perform |
| Oct 26, 2026 | Citigroup | main | Buy | Buy |
| Oct 23, 2026 | Wells Fargo | main | Overweight | Overweight |
About Huntington Bancshares Incorporated
Huntington Bancshares Incorporated operates as the bank holding company for The Huntington National Bank that provides commercial, consumer, and mortgage banking services. It offers financial products and services to consumer and business customers, including deposits, lending, payments, mortgage banking, dealer financing, investment management, trust, brokerage, insurance, and other financial products and services. The company also provides 24-Hour Grace, Asterisk-Free Checking, Money Scout, $50 Safety Zone, Standby Cash, Early Pay, Instant Access, Savings Goal Getter, And Huntington Heads Up; digitally powered consumer and business financial solutions to consumer finance, regional banking, branch banking, and wealth management customers; direct and indirect consumer loans; dealer finance loans and deposits; and private banking, wealth management and legacy planning through investment and portfolio management, fiduciary administration and trust, institutional custody, and full-service retail brokerage investment services. In addition, it offers equipment financing, asset-based lending, distribution finance, structured lending, municipal financing solutions, and Huntington ChoicePay. Additionally, the company provides lending, liquidity, treasury management and other payment services, and capital markets; government and non-profits, healthcare, technology and telecommunications, franchises, financial sponsors, fund finance, Native American financial, and global services; and corporate risk management, institutional sales and trading, debt and equity issuance, and additional advisory services. The company offers its products through a network of channels, including branches and ATMs, online and mobile banking, and through customer call centers to customers in middle market banking, corporate, specialty, and government banking, asset finance, commercial real estate banking, and capital markets. The company was founded in 1866 and is headquartered in Columbus, Ohio.
- Sector
- Financial Services
- Industry
- Banks - Regional
- Country
- United States
- Website
- huntington.com
News
 Huntington Bancshares Incorporated $HBAN Stock Sold by Fifth Third Bancorp
 Huntington Bancshares: Fixed Income Securities Are More Attractive After Recent Acquisitions
 Head-To-Head Survey: Huntington Bancshares (NASDAQ:HBAN) vs. Banco Do Brasil (OTCMKTS:BDORY)
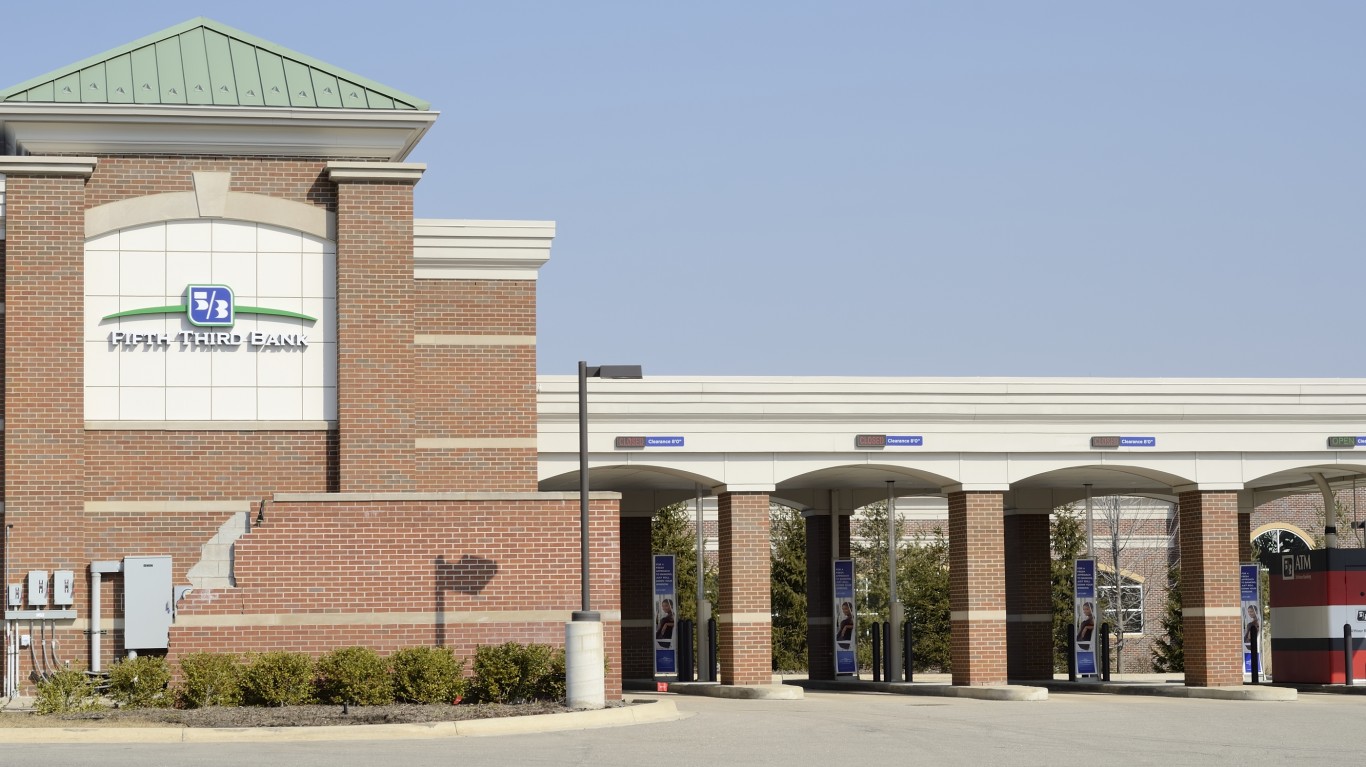 The Banks Behind Your Neighborhood Branch Pay Dividends Too: $120,000 Across These 3 Regional Banks Yields $4,478 a Year
 Alpha Buying: Bank Insiders Just Bought $4.1 Million in Shares
 Argus Research Maintains Buy on Huntington Bancshares, Lowers Price Target to $18
 Truist Securities Maintains Buy on Huntington Bancshares, Lowers Price Target to $18
 This M&T Bank Analyst Turns Bearish; Here Are Top 5 Downgrades For Tuesday
 Wolfe Research Downgrades Huntington Bancshares to Peer Perform
 Citigroup Maintains Buy on Huntington Bancshares, Lowers Price Target to $19
Your note
Sign in to keep a note on HBAN — it syncs with the Stock Master app.
Insider holders
| Insider | Relation | Latest transaction | Date | Shares held |
|---|---|---|---|---|
| HOUSTON HELGA S | Officer | Stock Award(Grant) | Mar 31, 2026 | 0 |
| KLEINMAN SCOTT D | Officer | Stock Award(Grant) | Sep 30, 2026 | 468,773 |
| NEU RICHARD W | Director | Stock Award(Grant) | Oct 25, 2026 | 0 |
| PORTEOUS DAVID L | Director | Stock Award(Grant) | Sep 30, 2026 | 0 |
| ROLLINS JAMES D III | Director | Sale | Jun 11, 2026 | 1,380,200 |
| SIT ROGER J. | Director | Stock Award(Grant) | Oct 25, 2026 | 0 |
Institution ownership
| Holder | % held | Shares | Value | Reported |
|---|---|---|---|---|
| Blackrock Inc. | 8.84% | 178,554,237 | 2.71B | Sep 29, 2026 |
| Wellington Management Group, LLP | 6.64% | 134,057,706 | 2.04B | Sep 29, 2026 |
| Vanguard Capital Management LLC | 6.54% | 132,107,223 | 2.01B | Sep 29, 2026 |
| State Street Corporation | 4.79% | 96,768,157 | 1.47B | Sep 29, 2026 |
| Vanguard Portfolio Management LLC | 4.63% | 93,557,512 | 1.42B | Sep 29, 2026 |
| Price (T.Rowe) Associates Inc | 4.33% | 87,428,210 | 1.33B | Sep 29, 2026 |
Fund ownership
| Holder | % held | Shares | Value | Reported |
|---|---|---|---|---|
| VANGUARD INDEX FUNDS-Vanguard Total Stock Market Index Fund | 3.19% | 64,355,653 | 978.21M | Jun 29, 2026 |
| VANGUARD INDEX FUNDS-Vanguard 500 Index Fund | 2.60% | 52,529,800 | 798.45M | Jun 29, 2026 |
| VANGUARD FENWAY FUNDS-Vanguard Equity Income Fund | 2.45% | 49,512,363 | 752.59M | Jun 29, 2026 |
| VANGUARD INDEX FUNDS-Vanguard Mid-Cap Index Fund | 2.17% | 43,923,700 | 667.64M | Jun 29, 2026 |
| iShares Trust-iShares Core S&P 500 ETF | 1.33% | 26,921,410 | 409.21M | Sep 29, 2026 |
| Fidelity Concord Street Trust-Fidelity 500 Index Fund | 1.30% | 26,257,225 | 399.11M | Sep 29, 2026 |