

Gladstone Commercial Corporation GOOD
Regular-session close
After hours · Nov 20, 4:01 PM ET
- YTD
- -14.71%
- 1 year
- -13.91%
5D -0.31 (-3.08%)
- Market cap
- 445.88M
- Revenue (ttm)
- 147.92M
- Profit margin
- 14.43%
- EPS (ttm)
- 0.13
- Shares out
- 43.92M
- P/E ratio
- 70.00
- Forward P/E
- 53.10
- Dividend
- 1.20 (7.48%)
- Ex-dividend date
- Dec 20, 2024
- YTD return
- -14.71%
- 1-year return
- -13.91%
- Volume
- 1.27M
- Avg volume
- 548.39K
- Open
- 9.49
- Previous close
- 9.56
- Day's range
- 9.09 – 9.65
- 52-week range
- 9.09 – 13.28
- Beta
- 1.21
- Price target
- 17.20 (+89.0%)
- 50-day average
- 16.70
- 200-day average
- 15.01
- Enterprise value
- 1.56B
Key statistics
- Price / sales
- 4.78
- Price / book
- 4.12
- Payout ratio
- 571.43%
- Revenue growth
- 7.60%
- Free cash flow
- 73.51M
- Total cash
- 14.39M
- Total debt
- 698.96M
- Return on equity
- 6.24%
- Short % of float
- 1.65%
Fundamental scorecard
9 of 25 checks passed on GOOD’s reported financials
9of 25 checks passed
- Value 2 of 5
- Growth 3 of 5
- Profitability 2 of 5
- Financial health 0 of 5
- Dividend 2 of 5
Statements to Sep 30, 2026.
Financials — quick view
Earnings
| Report date | Quarter ending | EPS estimate | EPS reported | Surprise | Surprise % |
|---|---|---|---|---|---|
| Nov 4, 2024 | Sep 1, 2024 | 0.35 | 0.20 | -0.15 | -42.86% |
| Aug 6, 2024 | Jun 1, 2024 | 0.33 | -0.04 | -0.37 | -112.12% |
| Aug 6, 2024 | Jun 1, 2024 | 0.33 | 0.36 | +0.03 | +9.09% |
| May 6, 2024 | Mar 1, 2024 | 0.34 | 0.34 | 0.00 | 0.00% |
| May 6, 2024 | Mar 1, 2024 | 0.34 | 0.01 | -0.33 | -97.06% |
| Feb 21, 2024 | Dec 1, 2023 | 0.34 | 0.36 | +0.02 | +5.88% |
Upgrades / downgrades
| Date | Firm | Action | From | To |
|---|---|---|---|---|
| Oct 10, 2024 | B. Riley Securities | reit | Neutral | Neutral |
| Mar 18, 2024 | Alliance Global Partners | init | — | Buy |
| May 8, 2023 | B. Riley Securities | main | — | Buy |
| May 4, 2023 | EF Hutton | main | — | Buy |
| Feb 27, 2023 | B. Riley Securities | main | — | Buy |
| Feb 24, 2023 | EF Hutton | reit | — | Buy |
About Gladstone Commercial Corporation
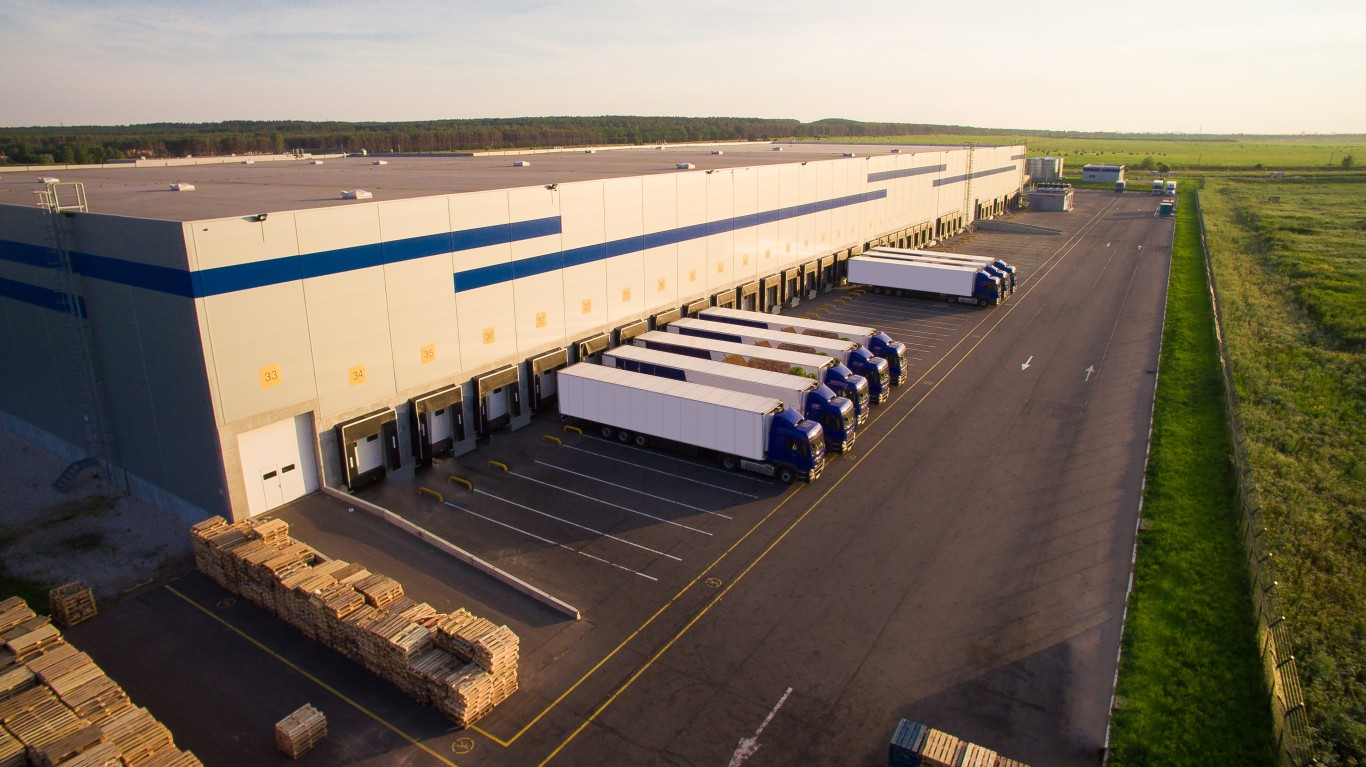
Gladstone Commercial Corporation is a real estate investment trust focused on acquiring, owning, and operating net leased industrial and office properties across the United States. Including payments through January 2024, Gladstone Commercial has paid 229 consecutive monthly cash distributions on its common stock. Prior to paying distributions on a monthly basis, Gladstone Commercial paid five consecutive quarterly cash distributions. Gladstone Commercial has never skipped or deferred a distribution since its inception in 2003.
- Sector
- Real Estate
- Industry
- REIT - Diversified
- Country
- United States
- Website
- gladstonecommercial.com
News
 Gladstone Commercial Corporation (GOOD) Is a Trending Stock: Facts to Know Before Betting on It
 Buried Treasures: 6 Strong, Undervalued High-Yield REITs
 3 Monthly Dividend Stocks Yielding Up to 12%. Two Have November 18 Deadlines
 Top 3 Real Estate Stocks That Could Blast Off In Q4
 B. Riley Securities Reiterates Neutral on Gladstone Commercial, Lowers Price Target to $11.5
 Gladstone Commercial Q3 2026 Earnings Call Transcript
Your note
Sign in to keep a note on GOOD — it syncs with the Stock Master app.
Insider holders
| Insider | Relation | Latest transaction | Date | Shares held |
|---|---|---|---|---|
| BECKHORN JAY | Officer and Treasurer | Purchase | Mar 5, 2023 | 1,387 |
| COOPER ARTHUR S | President | Purchase | Mar 5, 2023 | 0 |
| GERSON GARY | Chief Financial Officer | Purchase | Nov 7, 2024 | 15,277 |
| WISLAR ELLIOTT JR | Chief Investment Officer | Purchase | Mar 5, 2023 | 3,070 |
Institution ownership
| Holder | % held | Shares | Value | Reported |
|---|---|---|---|---|
| Vanguard Group Inc | 9.27% | 4,070,559 | 64.84M | Sep 29, 2024 |
| Blackrock Inc. | 8.07% | 3,542,780 | 56.44M | Sep 29, 2024 |
| Renaissance Technologies, LLC | 3.28% | 1,439,720 | 22.93M | Sep 29, 2024 |
| Geode Capital Management, LLC | 2.50% | 1,098,176 | 17.49M | Sep 29, 2024 |
| State Street Corporation | 2.39% | 1,051,383 | 16.75M | Sep 29, 2024 |
| Invesco Ltd. | 1.81% | 796,403 | 12.69M | Sep 29, 2024 |
Fund ownership
| Holder | % held | Shares | Value | Reported |
|---|---|---|---|---|
| Vanguard Specialized-Real Estate Index Fund | 3.65% | 1,604,483 | 25.56M | Jul 30, 2024 |
| Vanguard Total Stock Market Index Fund | 2.88% | 1,265,333 | 20.16M | Sep 29, 2024 |
| iShares Russell 2000 ETF | 2.36% | 1,036,591 | 16.51M | Oct 30, 2024 |
| Invesco ETF Tr-Invesco KBW Premium Yld Equity REIT ETF | 1.65% | 726,324 | 11.57M | Oct 30, 2024 |
| Global X Fds-Global X SuperDividend ETF | 1.36% | 596,962 | 9.51M | Oct 30, 2024 |
| Vanguard Extended Market Index Fund | 1.28% | 560,145 | 8.92M | Sep 29, 2024 |