

BXP, Inc. BXP
At closeNov 12, 2026, 4:00 PM EST
After hours · Nov 12, 4:00 PM ET
- YTD
- -6.80%
- 1 year
- -12.23%
- Market cap
- 11.36B
- Revenue (ttm)
- 3.24B
- Profit margin
- 16.47%
- EPS (ttm)
- 3.34
- Shares out
- 159.71M
- P/E ratio
- 18.83
- Forward P/E
- 30.16
- Dividend
- 2.80 (4.41%)
- Ex-dividend date
- Sep 29, 2026
- YTD return
- -6.80%
- 1-year return
- -12.23%
- Volume
- 812.02K
- Avg volume
- 1.40M
- Open
- 63.38
- Previous close
- 63.44
- Day's range
- 62.88 – 63.81
- 52-week range
- 49.72 – 74.94
- Beta
- 1.04
- Analysts
- Buy
- Price target
- 73.60 (+17.0%)
- Earnings date
- Jan 26, 2027
5D -1.15 (-1.79%)
Key statistics
- Enterprise value
- 28.59B
- PEG ratio
- 2.36
- Price / sales
- 3.51
- Price / book
- 1.93
- Dividend yield
- 4.41%
- Payout ratio
- 83.83%
- Revenue growth
- 5.30%
- Free cash flow
- 1.11B
- Total cash
- 1.48B
- Total debt
- 17.33B
- Return on equity
- 8.96%
- Short % of float
- 10.58%
- 50-day average
- 62.43
- 200-day average
- 61.99
Analyst view
Consensus: buy
- Target (low)
- 54.00
- Target (mean)
- 73.60
- Target (high)
- 95.00
- Strong buy4
- Buy7
- Hold11
- Sell0
- Strong sell0
Next earnings
Jan 26, 2027
Expected Jan 26, 2027. Consensus EPS estimate 0.58.
Financials — quick view
Earnings
| Report date | Quarter ending | EPS estimate | EPS reported | Surprise | Surprise % |
|---|---|---|---|---|---|
| Jan 26, 2027 | Dec 30, 2026 | 0.564 | — | — | — |
| Oct 27, 2026 | Sep 30, 2026 | 0.504 | 0.71 | +0.21 | +40.87% |
| Jul 28, 2026 | Jun 30, 2026 | 0.4031 | 0.43 | +0.03 | +6.67% |
| Apr 28, 2026 | Mar 31, 2026 | 0.43 | 0.64 | +0.21 | +48.84% |
| Jan 27, 2026 | Dec 31, 2025 | 0.563 | 1.57 | +1.01 | +178.86% |
| Oct 28, 2025 | Sep 30, 2025 | 0.51 | -0.77 | -1.28 | -250.98% |
Upgrades / downgrades
| Date | Firm | Action | From | To |
|---|---|---|---|---|
| Oct 29, 2026 | Piper Sandler | main | Neutral | Neutral |
| Oct 28, 2026 | Evercore ISI Group | main | In-Line | In-Line |
| Oct 12, 2026 | Piper Sandler | main | Overweight | Overweight |
| Sep 21, 2026 | Evercore ISI Group | main | In-Line | In-Line |
| Sep 17, 2026 | Scotiabank | main | Sector Outperform | Sector Outperform |
| Sep 9, 2026 | Truist Securities | main | Hold | Hold |
About BXP, Inc.
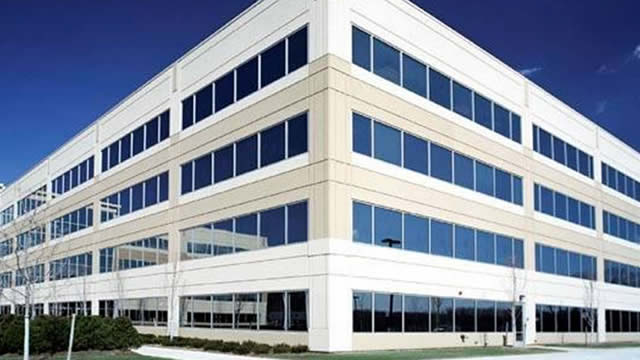
BXP, Inc. is the largest publicly traded developer, owner, and manager of premier workplaces in the United States. It is concentrated in six dynamic gateway markets - Boston, Los Angeles, New York, San Francisco, Seattle, and Washington, DC. BXP has delivered places that power progress for our clients and communities for more than 55 years. BXP is a fully integrated real estate company, organized as a real estate investment trust (REIT). As of June 30, 2026, including properties owned by joint ventures, BXP's portfolio totals 50.6 million square feet and 162 properties, including six properties under construction/redevelopment. BXP's portfolio consists of 141 office properties, 13 retail properties, seven residential properties (including four residential properties under construction) and one hotel. BXP is well known for its in-house building management expertise and responsiveness to clients' needs. BXP holds a superior track record of developing premium Central Business District (CBD) office buildings, successful mixed-use complexes, suburban office centers and build-to-suit projects for a diverse array of creditworthy clients. BXP actively works to promote its growth and operations in a sustainable and responsible manner. BXP, Inc. was incorporated in 1970 in Delaware and is based in Massachusetts, Boston.
- Sector
- Real Estate
- Industry
- REIT - Office
- Country
- United States
- Website
- bxp.com
News
 4 Office REITs Paying Dividends Despite the Slump. Which Are Safest?
 REITs: The Cure For High Rates Is High Rates
 Here's Why Boston Properties (BXP) is a Strong Value Stock
 Cast Your Vote On NYC Real Estate (4 Office REITs To Consider)
 Why Boston Properties (BXP) is a Top Momentum Stock for the Long-Term
 Piper Sandler Maintains Neutral on BXP, Raises Price Target to $65
 BXP Q3 Earnings Call Highlights
 BXP, Inc. (BXP) Q3 2026 Earnings Call Transcript
 BXP Q3 FFO & Revenues Beat Estimates on Occupancy Gains, 26' View Up
 BXP Q3 2026 Earnings Call Transcript
Your note
Sign in to keep a note on BXP — it syncs with the Stock Master app.
Insider holders
| Insider | Relation | Latest transaction | Date | Shares held |
|---|---|---|---|---|
| GARESCHE DONNA D | Officer | Sale | Mar 4, 2025 | 0 |
| HOSKINS DIANE J. | Director | Stock Award(Grant) | May 28, 2026 | 18,929 |
| KEVORKIAN ERIC G | Officer | Sale | May 21, 2026 | 311 |
| LABELLE MICHAEL E. | Chief Financial Officer | Sale | Jun 8, 2026 | 5,839 |
| NAUGHTON TIMOTHY JAMES | Director | Stock Award(Grant) | May 28, 2026 | 8,601 |
| RITCHEY RAYMOND A | Officer | Sale | Nov 30, 2025 | 14,150 |
Institution ownership
| Holder | % held | Shares | Value | Reported |
|---|---|---|---|---|
| Cohen & Steers Inc. | 14.27% | 22,784,376 | 1.43B | Jun 29, 2026 |
| Blackrock Inc. | 11.26% | 17,981,430 | 1.13B | Jun 29, 2026 |
| Vanguard Portfolio Management LLC | 8.12% | 12,963,896 | 815.43M | Jun 29, 2026 |
| Vanguard Capital Management LLC | 6.29% | 10,052,458 | 632.30M | Jun 29, 2026 |
| State Street Corporation | 6.16% | 9,845,148 | 619.26M | Jun 29, 2026 |
| First Eagle Investment Management, LLC | 5.94% | 9,479,197 | 596.24M | Sep 29, 2026 |
Fund ownership
| Holder | % held | Shares | Value | Reported |
|---|---|---|---|---|
| First Eagle Funds-First Eagle Global Fund | 4.11% | 6,565,788 | 412.99M | Jul 30, 2026 |
| VANGUARD SPECIALIZED FUNDS-Vanguard Real Estate Index Fund | 3.54% | 5,657,657 | 355.87M | Jul 30, 2026 |
| VANGUARD INDEX FUNDS-Vanguard Total Stock Market Index Fund | 3.17% | 5,066,591 | 318.69M | Jun 29, 2026 |
| VANGUARD INDEX FUNDS-Vanguard 500 Index Fund | 2.41% | 3,843,378 | 241.75M | Jun 29, 2026 |
| COHEN & STEERS REAL ESTATE SECURITIES Fd. INC-Cohen & Steers Real Esta | 2.31% | 3,683,143 | 231.67M | Jun 29, 2026 |
| VANGUARD INDEX FUNDS-Vanguard Small-Cap Index Fund | 2.29% | 3,654,865 | 229.89M | Jun 29, 2026 |