

Diamondback Energy, Inc. FANG
At closeNov 12, 2026, 7:23 PM EST
After hours · Nov 12, 7:23 PM ET
- YTD
- +21.20%
- 1 year
- +24.65%
- Market cap
- 50.86B
- Revenue (ttm)
- 17.66B
- Profit margin
- 11.62%
- EPS (ttm)
- 7.43
- Shares out
- 279.17M
- P/E ratio
- 24.52
- Forward P/E
- 8.41
- Dividend
- 4.72 (2.65%)
- Ex-dividend date
- Nov 11, 2026
- YTD return
- +21.20%
- 1-year return
- +24.65%
- Volume
- 1.07M
- Avg volume
- 2.43M
- Open
- 180.39
- Previous close
- 179.80
- Day's range
- 178.93 – 182.96
- 52-week range
- 139.41 – 216.90
- Beta
- 0.47
- Analysts
- Buy
- Price target
- 237.43 (+30.3%)
- Earnings date
- Feb 22, 2027
5D +3.41 (+1.91%)
Key statistics
- Enterprise value
- 69.36B
- PEG ratio
- 1.06
- Price / sales
- 2.88
- Price / book
- 1.31
- Dividend yield
- 2.61%
- Payout ratio
- 57.20%
- Revenue growth
- 32.00%
- Free cash flow
- 6.04B
- Total cash
- 558.00M
- Total debt
- 13.23B
- Return on equity
- 4.86%
- Short % of float
- 3.69%
- 50-day average
- 194.43
- 200-day average
- 190.89
Analyst view
Consensus: buy
- Target (low)
- 192.00
- Target (mean)
- 237.43
- Target (high)
- 269.00
- Strong buy6
- Buy20
- Hold6
- Sell0
- Strong sell0
Next earnings
Feb 22, 2027
Expected Feb 22, 2027. Consensus EPS estimate 6.81.
Financials — quick view
Earnings
| Report date | Quarter ending | EPS estimate | EPS reported | Surprise | Surprise % |
|---|---|---|---|---|---|
| Feb 22, 2027 | Dec 30, 2026 | 6.40 | — | — | — |
| Nov 2, 2026 | Sep 30, 2026 | 5.72 | 5.86 | +0.14 | +2.45% |
| Aug 3, 2026 | Jun 30, 2026 | 6.08 | 6.48 | +0.40 | +6.58% |
| May 4, 2026 | Mar 31, 2026 | 3.74 | 4.23 | +0.49 | +13.10% |
| Feb 23, 2026 | Dec 31, 2025 | 2.00 | 1.74 | -0.26 | -13.00% |
| Nov 3, 2025 | Sep 30, 2025 | 2.94 | 3.08 | +0.14 | +4.76% |
Upgrades / downgrades
| Date | Firm | Action | From | To |
|---|---|---|---|---|
| Nov 12, 2026 | Bernstein | down | Outperform | Market Perform |
| Nov 11, 2026 | UBS | main | Buy | Buy |
| Nov 4, 2026 | UBS | main | Buy | Buy |
| Nov 4, 2026 | Truist Securities | main | Buy | Buy |
| Nov 4, 2026 | Wells Fargo | main | Overweight | Overweight |
| Oct 15, 2026 | Scotiabank | init | — | Sector Outperform |
About Diamondback Energy, Inc.
Diamondback Energy, Inc., an independent oil and natural gas company, acquires, develops, explores, and exploits unconventional, onshore oil and natural gas reserves in the Permian Basin in West Texas, the United States. The company primarily focuses on the development of the Spraberry and Wolfcamp formations of the Midland Basin; and the Wolfcamp and Bone Spring formations of the Delaware Basin, both of which are part of the Permian Basin in West Texas and New Mexico. Diamondback Energy, Inc. was founded in 2007 and is headquartered in Midland, Texas.
- Sector
- Energy
- Industry
- Oil & Gas E&P
- Country
- United States
- Website
- diamondbackenergy.com
News
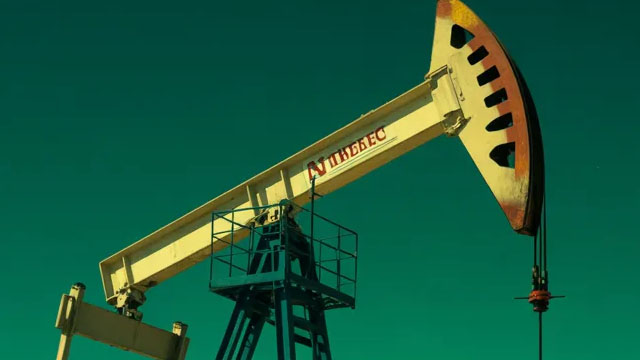 Here's Why Diamondback (FANG) Is a Great 'Buy the Bottom' Stock Now
 Bernstein Downgrades Diamondback Energy to Market Perform, Lowers Price Target to $192
 UBS Maintains Buy on Diamondback Energy, Raises Price Target to $263
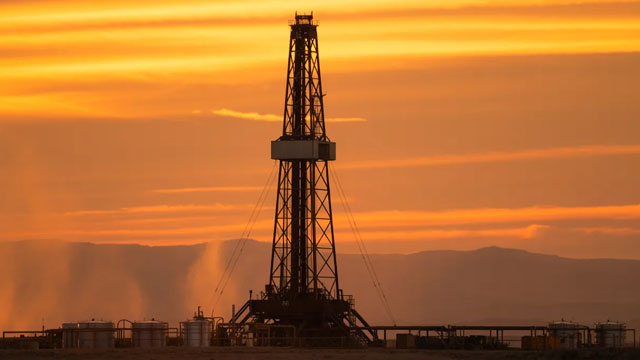 Diamondback and KKR to Acquire Five Point's 70% Stake in Deep Blue
 Buy These 3 Stocks with Broker Rating Upgrades for Big Gains
 Diamondback Energy And KKR To Acquire Five Point Infrastructure's 70% Stake In Produced-Water Infrastructure Platform Deep Blue Midland Basin For An Undisclosed Cash Sum
 Five Point Infrastructure Announces Sale of Deep Blue Midland Basin to Diamondback Energy and KKR
 Diamondback Energy and KKR to Acquire Deep Blue Midland Basin from Five Point Infrastructure
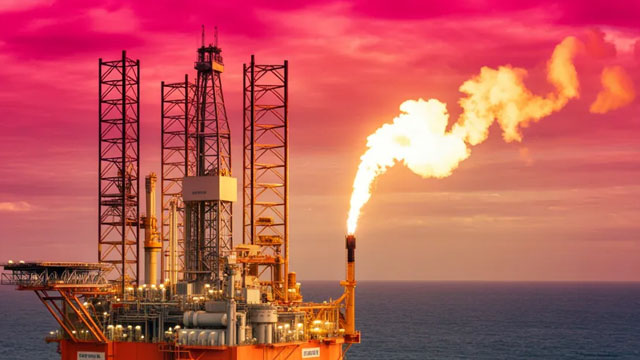 Diamondback Energy Sees New Revenue Potential in AI Power Boom
 5 Oil Stocks Could Turn $500,000 Into $14,000 a Year in Dividend Income
Your note
Sign in to keep a note on FANG — it syncs with the Stock Master app.
Insider holders
| Insider | Relation | Latest transaction | Date | Shares held |
|---|---|---|---|---|
| BARKMANN ALBERT | Officer | Sale | May 14, 2026 | 24,571 |
| DICK TERESA L | Officer | Sale | Sep 14, 2026 | 75,755 |
| MELOY CHARLES ALVIN | Director | Sale | Oct 4, 2026 | 0 |
| SGF FANG HOLDINGS,LP | Beneficial Owner of more than 10% of a Class of Security | Sale | Sep 15, 2026 | 64,957,000 |
| STICE TRAVIS D | Director | Sale | Sep 10, 2026 | 355,041 |
| THOMPSON JERE W III | Officer | Sale | Aug 13, 2026 | 18,475 |
Institution ownership
| Holder | % held | Shares | Value | Reported |
|---|---|---|---|---|
| Blackrock Inc. | 6.73% | 18,792,594 | 3.42B | Jun 29, 2026 |
| Wellington Management Group, LLP | 5.88% | 16,420,247 | 2.99B | Jun 29, 2026 |
| Vanguard Capital Management LLC | 4.58% | 12,775,007 | 2.33B | Jun 29, 2026 |
| State Street Corporation | 4.50% | 12,562,224 | 2.29B | Jun 29, 2026 |
| Invesco Ltd. | 4.00% | 11,180,445 | 2.04B | Jun 29, 2026 |
| Vanguard Portfolio Management LLC | 3.48% | 9,706,610 | 1.77B | Jun 29, 2026 |
Fund ownership
| Holder | % held | Shares | Value | Reported |
|---|---|---|---|---|
| VANGUARD FENWAY FUNDS-Vanguard Equity Income Fund | 2.52% | 7,035,307 | 1.28B | Jun 29, 2026 |
| VANGUARD INDEX FUNDS-Vanguard Total Stock Market Index Fund | 2.24% | 6,251,783 | 1.14B | Jun 29, 2026 |
| Invesco QQQ Trust, Series 1 | 2.10% | 5,849,160 | 1.07B | Sep 29, 2026 |
| AMERICAN BALANCED FUND | 1.83% | 5,119,909 | 932.85M | Sep 29, 2026 |
| VANGUARD INDEX FUNDS-Vanguard 500 Index Fund | 1.80% | 5,029,671 | 916.41M | Jun 29, 2026 |
| VANGUARD INDEX FUNDS-Vanguard Mid-Cap Index Fund | 1.53% | 4,266,638 | 777.38M | Jun 29, 2026 |