

ESAB Corporation ESAB
79.67 USD +1.31 (+1.67%)
Nov 5, 2026, 10:04 AM EST
78.49 Day range 81.85
62.74 52-week range 137.42
- YTD
- -28.69%
- 1 year
- -29.17%
- Market cap
- 4.96B
- Revenue (ttm)
- 3.00B
- Profit margin
- 5.75%
- EPS (ttm)
- 2.78
- Shares out
- 62.17M
- P/E ratio
- 28.72
- Forward P/E
- 12.28
- Dividend
- 0.48 (0.63%)
- Ex-dividend date
- Oct 1, 2026
- YTD return
- -28.69%
- 1-year return
- -29.17%
- Volume
- 81.69K
- Avg volume
- 1.02M
- Open
- 79.21
- Previous close
- 78.36
- Day's range
- 78.49 – 81.85
- 52-week range
- 62.74 – 137.42
- Beta
- 1.13
- Analysts
- Strong Buy
- Price target
- 119.73 (+50.3%)
- Earnings date
- Feb 19, 2027
2Y -46.39 (-36.61%)
Key statistics
- Enterprise value
- 7.27B
- PEG ratio
- 0.78
- Price / sales
- 1.62
- Price / book
- 2.06
- Dividend yield
- 0.63%
- Payout ratio
- 13.08%
- Revenue growth
- 12.90%
- Free cash flow
- 146.13M
- Total cash
- 217.49M
- Total debt
- 2.54B
- Return on equity
- 8.73%
- Short % of float
- 9.35%
- 50-day average
- 69.93
- 200-day average
- 92.85
Analyst view
Consensus: strong buy
Strong buy
Price target (mean) 119.73 +50.3% upside
Now 79.67
- Target (low)
- 95.00
- Target (mean)
- 119.73
- Target (high)
- 145.00
Ratings (0m) 11 10 buy · 1 hold · 0 sell
- Strong buy1
- Buy9
- Hold1
- Sell0
- Strong sell0
Next earnings
Feb 19, 2027
Expected Feb 19, 2027. Consensus EPS estimate 1.33.
Financials — quick view
ESAB Revenue — quarterly 807.63M
ESAB Net income — quarterly 32.35M
ESAB EPS — quarterly 0.50
Earnings
| Report date | Quarter ending | EPS estimate | EPS reported | Surprise | Surprise % |
|---|---|---|---|---|---|
| Feb 19, 2027 | Jan 2, 2027 | 1.41 | — | — | — |
| Nov 4, 2026 | Oct 2, 2026 | 1.33 | 1.30 | -0.03 | -2.26% |
| Aug 6, 2026 | Jul 3, 2026 | 1.36 | 1.33 | -0.03 | -2.21% |
| May 7, 2026 | Apr 3, 2026 | 1.32 | 1.31 | -0.01 | -0.76% |
| Feb 20, 2026 | Dec 31, 2025 | 1.34 | 1.35 | +0.01 | +0.75% |
| Oct 29, 2025 | Oct 3, 2025 | 1.27 | 1.32 | +0.05 | +3.94% |
Upgrades / downgrades
| Date | Firm | Action | From | To |
|---|---|---|---|---|
| Oct 21, 2026 | Oppenheimer | main | Outperform | Outperform |
| Oct 8, 2026 | JP Morgan | main | Overweight | Overweight |
| Sep 15, 2026 | Roth Capital | reit | Buy | Buy |
| Aug 11, 2026 | Evercore ISI Group | main | In-Line | In-Line |
| Jul 21, 2026 | Oppenheimer | main | Outperform | Outperform |
| Jul 20, 2026 | Stifel | main | Buy | Buy |
About ESAB Corporation
ESAB Corporation engages in the formulation, development, manufacture, and supply of consumable products and equipment for use in cutting, joining, automated welding, and gas control equipment. It offers its products through independent distributors and direct salespeople. It operates in Europe, Asia Pacific, South America, and the Middle East. ESAB Corporation was founded in 1904 and is headquartered in North Bethesda, Maryland.
- Sector
- Industrials
- Industry
- Metal Fabrication
- Country
- United States
- Website
- esabcorporation.com
News
 What ESAB (ESAB) Said on Its Q3 Earnings Call
 ESAB Corporation (ESAB) Q3 2026 Earnings Call Transcript
 Esab (ESAB) Q3 Earnings Lag Estimates
 ESAB Q3 2026 Earnings Call Transcript
 ESAB Q3 Adj. EPS $1.30 Misses $1.32 Estimate, Sales $824.521M Beat $803.776M Estimate
 ESAB Corporation Announces Third Quarter 2026 Results
 Esab (ESAB) Earnings Expected to Grow: What to Know Ahead of Next Week's Release
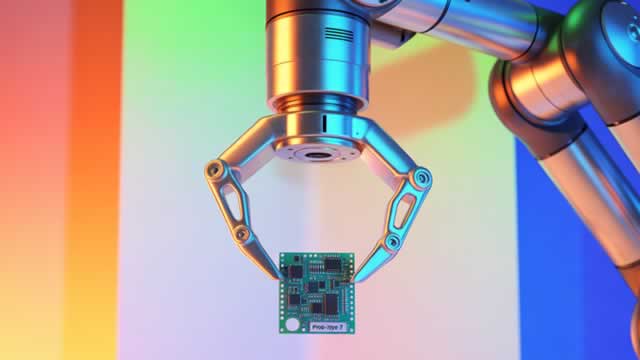
 ESAB ROBBI AI™ Cobot for MIG and TIG Welding Automation Brings Physical AI to the Shop Floor
 Oppenheimer Maintains Outperform on ESAB, Lowers Price Target to $110
 Head-To-Head Analysis: Hyster-Yale (NYSE:HY) vs. ESAB (NYSE:ESAB)
Your note
Sign in to keep a note on ESAB — it syncs with the Stock Master app.
Insider holders
| Insider | Relation | Latest transaction | Date | Shares held |
|---|---|---|---|---|
| ALLENDER PATRICK W | Director | Conversion of Exercise of derivative security | May 1, 2025 | 79,807 |
| BIEBUYCK OLIVIER | Officer | Conversion of Exercise of derivative security | May 11, 2026 | 20,556 |
| CAMPION MICHELE | Officer | Conversion of Exercise of derivative security | May 11, 2026 | 15,206 |
| JEWELL CURTIS E | General Counsel | Conversion of Exercise of derivative security | May 11, 2026 | 19,994 |
| JOHNSON KEVIN J | Chief Financial Officer | Stock Award(Grant) | Mar 8, 2026 | 32,561 |
| KAMBEYANDA SHYAM | Chief Executive Officer | Conversion of Exercise of derivative security | May 11, 2026 | 124,944 |
Institution ownership
| Holder | % held | Shares | Value | Reported |
|---|---|---|---|---|
| Price (T.Rowe) Associates Inc | 13.07% | 8,126,296 | 636.13M | Jun 29, 2026 |
| T. Rowe Price Investment Management, Inc. | 12.26% | 7,622,001 | 596.65M | Jun 29, 2026 |
| Blackrock Inc. | 8.55% | 5,318,185 | 416.31M | Jun 29, 2026 |
| Invesco Ltd. | 4.46% | 2,770,472 | 216.87M | Jun 29, 2026 |
| Vanguard Capital Management LLC | 4.20% | 2,609,497 | 204.27M | Jun 29, 2026 |
| Vanguard Portfolio Management LLC | 3.98% | 2,475,282 | 193.77M | Jun 29, 2026 |
Fund ownership
| Holder | % held | Shares | Value | Reported |
|---|---|---|---|---|
| SmallCap World Fund Inc | 4.17% | 2,591,650 | 202.87M | Sep 29, 2026 |
| T. Rowe Price Mid-Cap Growth Fund, Inc. | 4.03% | 2,503,110 | 195.94M | Jun 29, 2026 |
| iShares Trust-iShares Core S&P Mid-Cap ETF | 3.34% | 2,079,495 | 162.78M | Sep 29, 2026 |
| AIM Sector Funds (Invesco Sector Funds)-Invesco Small Cap Value Fund | 3.00% | 1,864,526 | 145.96M | Jul 30, 2026 |
| VANGUARD INDEX FUNDS-Vanguard Total Stock Market Index Fund | 2.95% | 1,834,688 | 143.62M | Jun 29, 2026 |
| T. Rowe Price Mid-Cap Value Fund, Inc. | 2.50% | 1,552,231 | 121.51M | Jun 29, 2026 |