

D.R. Horton, Inc. DHI
At closeNov 5, 2026, 4:00 AM EST
Pre-market · Nov 5, 4:00 AM ET
- YTD
- +9.00%
- 1 year
- +7.83%
- Market cap
- 42.61B
- Revenue (ttm)
- 33.04B
- Profit margin
- 8.74%
- EPS (ttm)
- 10.11
- Shares out
- 271.44M
- P/E ratio
- 15.53
- Forward P/E
- 14.53
- Dividend
- 2.00 (1.38%)
- Ex-dividend date
- Nov 11, 2026
- YTD return
- +9.00%
- 1-year return
- +7.83%
- Volume
- 4.86M
- Avg volume
- 2.72M
- Open
- 152.44
- Previous close
- 145.23
- Day's range
- 151.12 – 157.81
- 52-week range
- 130.40 – 170.79
- Beta
- 1.37
- Analysts
- Hold
- Price target
- 146.50 (-6.7%)
- Earnings date
- Jan 19, 2027
YTD +11.27 (+7.73%)
Key statistics
- Enterprise value
- 44.02B
- PEG ratio
- 1.81
- Price / sales
- 1.29
- Price / book
- 1.84
- Dividend yield
- 1.38%
- Payout ratio
- 16.68%
- Revenue growth
- -3.20%
- Free cash flow
- 7.82B
- Total cash
- 2.06B
- Total debt
- 6.05B
- Return on equity
- 12.12%
- Short % of float
- 6.11%
- 50-day average
- 140.83
- 200-day average
- 147.49
Analyst view
Consensus: hold
- Target (low)
- 114.00
- Target (mean)
- 146.50
- Target (high)
- 186.00
- Strong buy0
- Buy4
- Hold14
- Sell1
- Strong sell2
Next earnings
Jan 19, 2027
Expected Jan 19, 2027. Consensus EPS estimate 1.30.
Financials — quick view
Earnings
| Report date | Quarter ending | EPS estimate | EPS reported | Surprise | Surprise % |
|---|---|---|---|---|---|
| Jan 19, 2027 | Dec 30, 2026 | 1.34 | — | — | — |
| Oct 29, 2026 | Sep 30, 2026 | 3.01 | 2.67 | -0.34 | -11.30% |
| Jul 21, 2026 | Jun 30, 2026 | 3.02 | 3.20 | +0.18 | +5.96% |
| Apr 21, 2026 | Mar 31, 2026 | 2.15 | 2.24 | +0.09 | +4.19% |
| Jan 20, 2026 | Dec 31, 2025 | 1.93 | 2.03 | +0.10 | +5.18% |
| Oct 28, 2025 | Sep 30, 2025 | 3.27 | 3.04 | -0.23 | -7.03% |
Upgrades / downgrades
| Date | Firm | Action | From | To |
|---|---|---|---|---|
| Nov 3, 2026 | Morgan Stanley | main | Equal-Weight | Equal-Weight |
| Nov 3, 2026 | Raymond James | down | Market Perform | Underperform |
| Nov 2, 2026 | Citigroup | main | Neutral | Neutral |
| Oct 30, 2026 | RBC Capital | main | Underperform | Underperform |
| Oct 30, 2026 | Barclays | main | Equal-Weight | Equal-Weight |
| Oct 30, 2026 | Evercore ISI Group | main | In-Line | In-Line |
About D.R. Horton, Inc.
D.R. Horton, Inc. operates as a homebuilding company in East, North, Southeast, South Central, Southwest, and Northwest regions in the United States. It engages in the acquisition and development of land; and construction and sale of residential homes in 126 markets across 36 states under the names of D.R. Horton. The company also constructs and sells single-family detached homes; and attached homes, such as townhomes and duplexes. In addition, it provides mortgage financing and title agency services; and engages in the residential lot development business. Further, the company develops, constructs, owns, leases, and sells multi-family and single-family rental properties; conducts insurance-related operations; and owns water rights and other water-related assets, as well as non-residential real estate, including ranch land and improvements. It primarily serves homebuyers. D.R. Horton, Inc. was founded in 1978 and is headquartered in Arlington, Texas.
- Sector
- Consumer Cyclical
- Industry
- Residential Construction
- Country
- United States
- Website
- drhorton.com
News
 $100 Invested In D.R. Horton 15 Years Ago Would Be Worth This Much Today
 Dividend Announcements: October 24-30, 2026 (Part 1 Of 2)
 Morgan Stanley Maintains Equal-Weight on D.R. Horton, Lowers Price Target to $130
 This Marvell Technology Analyst Is No Longer Bullish; Here Are Top 5 Downgrades For Tuesday
 Homebuilders, Miners and Regional Banks Soar as Oil Drops 8%: Has the Hormuz Peace Trade Begun?
- Citigroup Maintains Neutral on D.R. Horton, Raises Price Target to $152
 Dividend Champion, Contender, And Challenger Highlights: Week November 1
 RBC Capital Maintains Underperform on D.R. Horton, Lowers Price Target to $114
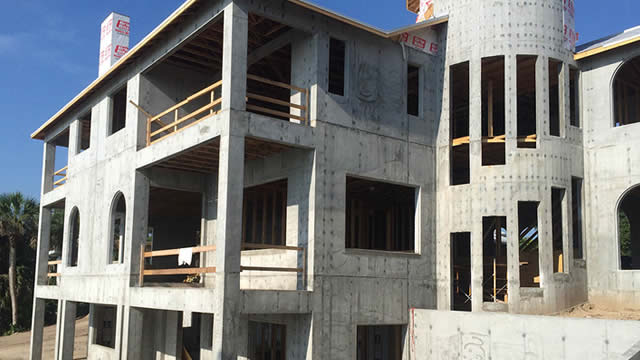 Inside giant homebuilder D.R. Horton's bet on robotic homebuilding
 Barclays Maintains Equal-Weight on D.R. Horton, Lowers Price Target to $125
Your note
Sign in to keep a note on DHI — it syncs with the Stock Master app.
Insider holders
| Insider | Relation | Latest transaction | Date | Shares held |
|---|---|---|---|---|
| ANDERSON BRADLEY S | Director | Conversion of Exercise of derivative security | Oct 28, 2026 | 37,087 |
| AULD DAVID V | Officer and Director | Stock Award(Grant) | Oct 29, 2026 | 976,181 |
| BUCHANAN MICHAEL R | Director | Conversion of Exercise of derivative security | Nov 19, 2025 | 9,618 |
| CARSON BENJAMIN S SR | Director | Conversion of Exercise of derivative security | Oct 28, 2026 | 10,064 |
| CROW MICHAEL CHAD | Director | Conversion of Exercise of derivative security | Oct 28, 2026 | 1,263 |
| MILLER MARIBESS L | Director | Conversion of Exercise of derivative security | Oct 28, 2026 | 22,604 |
Institution ownership
| Holder | % held | Shares | Value | Reported |
|---|---|---|---|---|
| Capital World Investors | 13.33% | 37,280,759 | 5.85B | Jun 29, 2026 |
| Blackrock Inc. | 8.93% | 24,974,471 | 3.92B | Jun 29, 2026 |
| Vanguard Capital Management LLC | 6.06% | 16,937,322 | 2.66B | Jun 29, 2026 |
| Vanguard Portfolio Management LLC | 4.43% | 12,400,299 | 1.95B | Jun 29, 2026 |
| State Street Corporation | 4.32% | 12,077,744 | 1.90B | Jun 29, 2026 |
| FMR, LLC | 3.38% | 9,440,491 | 1.48B | Jun 29, 2026 |
Fund ownership
| Holder | % held | Shares | Value | Reported |
|---|---|---|---|---|
| Growth Fund of America | 4.80% | 13,419,930 | 2.11B | Sep 29, 2026 |
| VANGUARD INDEX FUNDS-Vanguard Total Stock Market Index Fund | 2.90% | 8,102,590 | 1.27B | Jun 29, 2026 |
| WASHINGTON MUTUAL INVESTORS FUND | 2.59% | 7,232,012 | 1.14B | Sep 29, 2026 |
| AMERICAN BALANCED FUND | 2.59% | 7,239,622 | 1.14B | Sep 29, 2026 |
| VANGUARD INDEX FUNDS-Vanguard 500 Index Fund | 2.44% | 6,833,445 | 1.07B | Jun 29, 2026 |
| VANGUARD INDEX FUNDS-Vanguard Mid-Cap Index Fund | 1.98% | 5,530,277 | 868.36M | Jun 29, 2026 |