

Casella Waste Systems, Inc. CWST
Regular-session close
After hours · Nov 20, 4:00 PM ET
- YTD
- +1.38%
- 1 year
- +6.74%
5D -1.97 (-1.95%)
- Market cap
- 6.32B
- Revenue (ttm)
- 2.03B
- Profit margin
- -0.56%
- EPS (ttm)
- -0.18
- Shares out
- 62.66M
- Forward P/E
- 65.87
- YTD return
- +1.38%
- 1-year return
- +6.74%
- 50-day average
- 90.34
- 200-day average
- 89.68
- Volume
- 758.89K
- Avg volume
- 633.78K
- Open
- 98.49
- Previous close
- 98.39
- Day's range
- 98.49 – 101.30
- 52-week range
- 74.97 – 107.34
- Beta
- 0.70
- Analysts
- Buy
- Price target
- 107.50 (+8.3%)
- Earnings date
- Feb 18, 2027
Key statistics
- Enterprise value
- 7.72B
- PEG ratio
- 3.29
- Price / sales
- 3.11
- Price / book
- 4.00
- Revenue growth
- 15.20%
- Free cash flow
- 107.92M
- Total cash
- 14.56M
- Total debt
- 1.47B
- Return on equity
- -0.72%
- Short % of float
- 10.15%
Fundamental scorecard
6 of 25 checks passed on CWST’s reported financials
6of 25 checks passed
- Value 2 of 5
- Growth 2 of 5
- Profitability 1 of 5
- Financial health 1 of 5
- Dividend 0 of 5
Statements to Sep 30, 2026.
Analyst view
Consensus: buy
- Target (low)
- 94.00
- Target (mean)
- 107.50
- Target (high)
- 130.00
- Strong buy1
- Buy6
- Hold3
- Sell0
- Strong sell1
Next earnings
Feb 18, 2027
Expected Feb 18, 2027. Consensus EPS estimate 0.37985.
Financials — quick view
Earnings
| Report date | Quarter ending | EPS estimate | EPS reported | Surprise | Surprise % |
|---|---|---|---|---|---|
| Feb 18, 2027 | Dec 30, 2026 | 0.33 | — | — | — |
| Nov 9, 2026 | Sep 30, 2026 | 0.4113 | 0.35 | -0.06 | -14.90% |
| Aug 6, 2026 | Jun 30, 2026 | 0.3564 | 0.40 | +0.04 | +12.23% |
| Apr 30, 2026 | Mar 31, 2026 | 0.10 | 0.20 | +0.10 | +100.00% |
| Feb 19, 2026 | Dec 31, 2025 | 0.22 | 0.30 | +0.08 | +36.36% |
| Oct 30, 2025 | Sep 30, 2025 | 0.3335 | 0.42 | +0.09 | +25.94% |
Upgrades / downgrades
| Date | Firm | Action | From | To |
|---|---|---|---|---|
| Nov 11, 2026 | Barclays | main | Overweight | Overweight |
| Oct 21, 2026 | JP Morgan | main | Neutral | Neutral |
| Oct 21, 2026 | UBS | down | Buy | Neutral |
| Oct 8, 2026 | JP Morgan | main | Neutral | Neutral |
| Aug 10, 2026 | JP Morgan | main | Neutral | Neutral |
| Aug 10, 2026 | Barclays | main | Overweight | Overweight |
About Casella Waste Systems, Inc.
Casella Waste Systems, Inc., together with its subsidiaries, operates as a vertically integrated solid waste services company in the United States. The company offers resource management expertise and services primarily in the areas of solid waste collection and disposal, transfer, recycling and organics services to residential, commercial, municipal, institutional, and industrial customers. It also provides non-hazardous solid waste services, including collections, transfer stations, recycling, and disposal operations. In addition, the company markets various materials, including fibers, such as corrugated cardboard and newsprint, plastics, glass, ferrous, and aluminum metals. Casella Waste Systems, Inc. was founded in 1975 and is headquartered in Rutland, Vermont.
- Sector
- Industrials
- Industry
- Waste Management
- Country
- United States
- Website
- casella.com
News
 Casella Waste Systems, Inc. Announces Board Leadership Transition
 Aberdeen Group plc Sells 76,435 Shares of Casella Waste Systems, Inc. $CWST
 Casella Waste Systems, Inc. $CWST Stock Bought by Bessemer Group Inc.
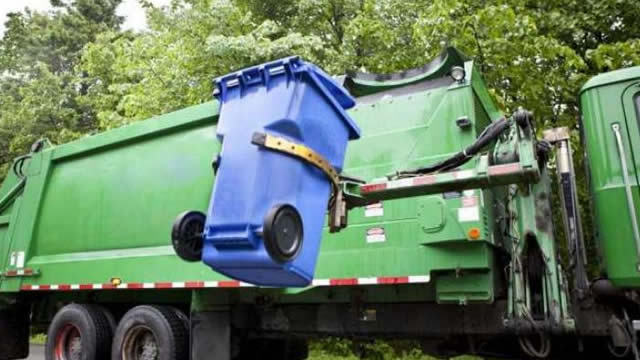 Jana Partners Cashes Out of One Data Center Stock for Another and Buys Trash Company Stock in Q3
 Jana Partners Cashes Out of One Data Center Stock for Another and Buys Trash Company Stock in Q3
 Barclays Maintains Overweight on Casella Waste Systems, Raises Price Target to $109
 Casella Waste Systems Q3 2026 Earnings Call Transcript
 Casella Waste Sys Q3 Adj. EPS $0.35 Misses $0.38 Estimate, Sales $559.231M Miss $563.179M Estimate
- Casella Waste Systems Raises FY2026 Sales Guidance from $2.090B-$2.110B to $2.100B-$2.110B vs $2.104B Est
Your note
Sign in to keep a note on CWST — it syncs with the Stock Master app.
Insider holders
| Insider | Relation | Latest transaction | Date | Shares held |
|---|---|---|---|---|
| BATTLES MICHAEL LOUIS | Director | Stock Award(Grant) | Jun 3, 2026 | 10,289 |
| BURKE MICHAEL K | Director | Sale | Sep 2, 2026 | 13,641 |
| CASELLA DOUGLAS R | Officer and Director | Sale | Aug 13, 2026 | 90,141 |
| CASELLA JOHN W | Chief Executive Officer | Sale | Feb 26, 2026 | 28,683 |
| COLETTA EDMOND R | Chief Executive Officer | Sale | May 18, 2026 | 140,118 |
| DOODY JOSEPH G | Director | Stock Award(Grant) | Jun 3, 2026 | 13,143 |
Institution ownership
| Holder | % held | Shares | Value | Reported |
|---|---|---|---|---|
| Blackrock Inc. | 14.79% | 9,269,555 | 920.37M | Sep 29, 2026 |
| Vanguard Portfolio Management LLC | 5.42% | 3,394,509 | 337.04M | Sep 29, 2026 |
| Wasatch Advisors LP | 4.88% | 3,056,089 | 303.44M | Sep 29, 2026 |
| Vanguard Capital Management LLC | 4.50% | 2,820,582 | 280.06M | Sep 29, 2026 |
| State Street Corporation | 4.05% | 2,536,008 | 251.80M | Sep 29, 2026 |
| T. Rowe Price Investment Management, Inc. | 3.87% | 2,422,683 | 240.55M | Sep 29, 2026 |
Fund ownership
| Holder | % held | Shares | Value | Reported |
|---|---|---|---|---|
| iShares Trust-iShares Core S&P Small-Cap ETF | 5.96% | 3,731,664 | 370.52M | Sep 29, 2026 |
| SmallCap World Fund Inc | 4.21% | 2,639,881 | 262.11M | Sep 29, 2026 |
| VANGUARD INDEX FUNDS-Vanguard Total Stock Market Index Fund | 3.17% | 1,988,602 | 197.45M | Jun 29, 2026 |
| iShares Trust-iShares Russell 2000 ETF | 2.64% | 1,653,850 | 164.21M | Sep 29, 2026 |
| VANGUARD INDEX FUNDS-Vanguard Small-Cap Index Fund | 2.29% | 1,436,720 | 142.65M | Jun 29, 2026 |
| WASATCH FUNDS TRUST-Wasatch Core Growth Fund | 1.87% | 1,169,848 | 116.15M | Sep 29, 2026 |