

State Street Technology Select Sector SPDR ETF XLK
162.31 USD -14.19 (-8.04%)
At closeNov 5, 2026, 4:21 PM EST
162.00 -0.31 -0.19%
After hours · Nov 5, 4:21 PM ET
162.14 Day range 172.72
126.68 52-week range 203.25
- YTD
- +12.74%
- 1 year
- +10.01%
- Market cap
- 117.03B
- EPS (ttm)
- 5.67
- P/E ratio
- 28.62
- YTD return
- +12.74%
- 1-year return
- +10.01%
- Volume
- 33.09M
- Avg volume
- 7.77M
- Open
- 172.33
- Previous close
- 176.50
- Day's range
- 162.14 – 172.72
- 52-week range
- 126.68 – 203.25
- Earnings date
- May 15, 2006
1D -14.19 (-8.04%)
Key statistics
- Enterprise value
- 0
- PEG ratio
- 0.00
- Price / sales
- 0.00
- Price / book
- 0.00
- Dividend yield
- 0.00%
- Payout ratio
- 0.00%
- Revenue growth
- 0.00%
- Free cash flow
- 0
- Total cash
- 0
- Total debt
- 0
- Return on equity
- 0.00%
- Short % of float
- 0.00%
- 50-day average
- 189.44
- 200-day average
- 169.84
Next earnings
May 15, 2006
Expected May 15, 2006. Consensus EPS estimate 0.00.
Earnings
| Report date | Quarter ending | EPS estimate | EPS reported | Surprise | Surprise % |
|---|---|---|---|---|---|
| May 15, 2006 | Mar 31, 2006 | 0.26 | — | — | — |
| May 15, 2006 | Dec 31, 2005 | 0.26 | — | — | — |
| Feb 15, 2005 | Sep 30, 2004 | 0.25 | 0.26 | +0.01 | +4.00% |
| Feb 15, 2005 | Dec 31, 2004 | 0.25 | 0.26 | +0.01 | +4.00% |
About State Street Technology Select Sector SPDR ETF
In seeking to track the performance of the index, the fund employs a replication strategy, which means that the fund typically invests in substantially all of the securities represented in the index in approximately the same proportions as the index. It generally invests substantially all, but at least 95%, of its total assets in the securities comprising the index. The fund is non-diversified.
News
 VIX Spikes 39% as AI Tech Rout Wipes Out $2.2 Trillion: Stock Market Today
 Defensives Lead Sectors Thursday As Growth Sectors Trail
 Politicians Fight Data Centers While Betting Your Retirement on Them
 How a blue wave crushed the tech right
 8 Of 11 Sectors Rise Wednesday As Growth Leads
 Dow Futures Fall as Democrats Take Control of Congress: Peter Schiff Warns Trump Now Has a ‘Scapegoat’ for the ‘Coming Economic Collapse’
 Growth And Cyclical Lead Sectors Tuesday
 Nasdaq 100 Gets a Lift As Nvidia Overtakes Apple: Stock Market Today
 CoreWeave Stock Is Soaring Tuesday: What's Going On?
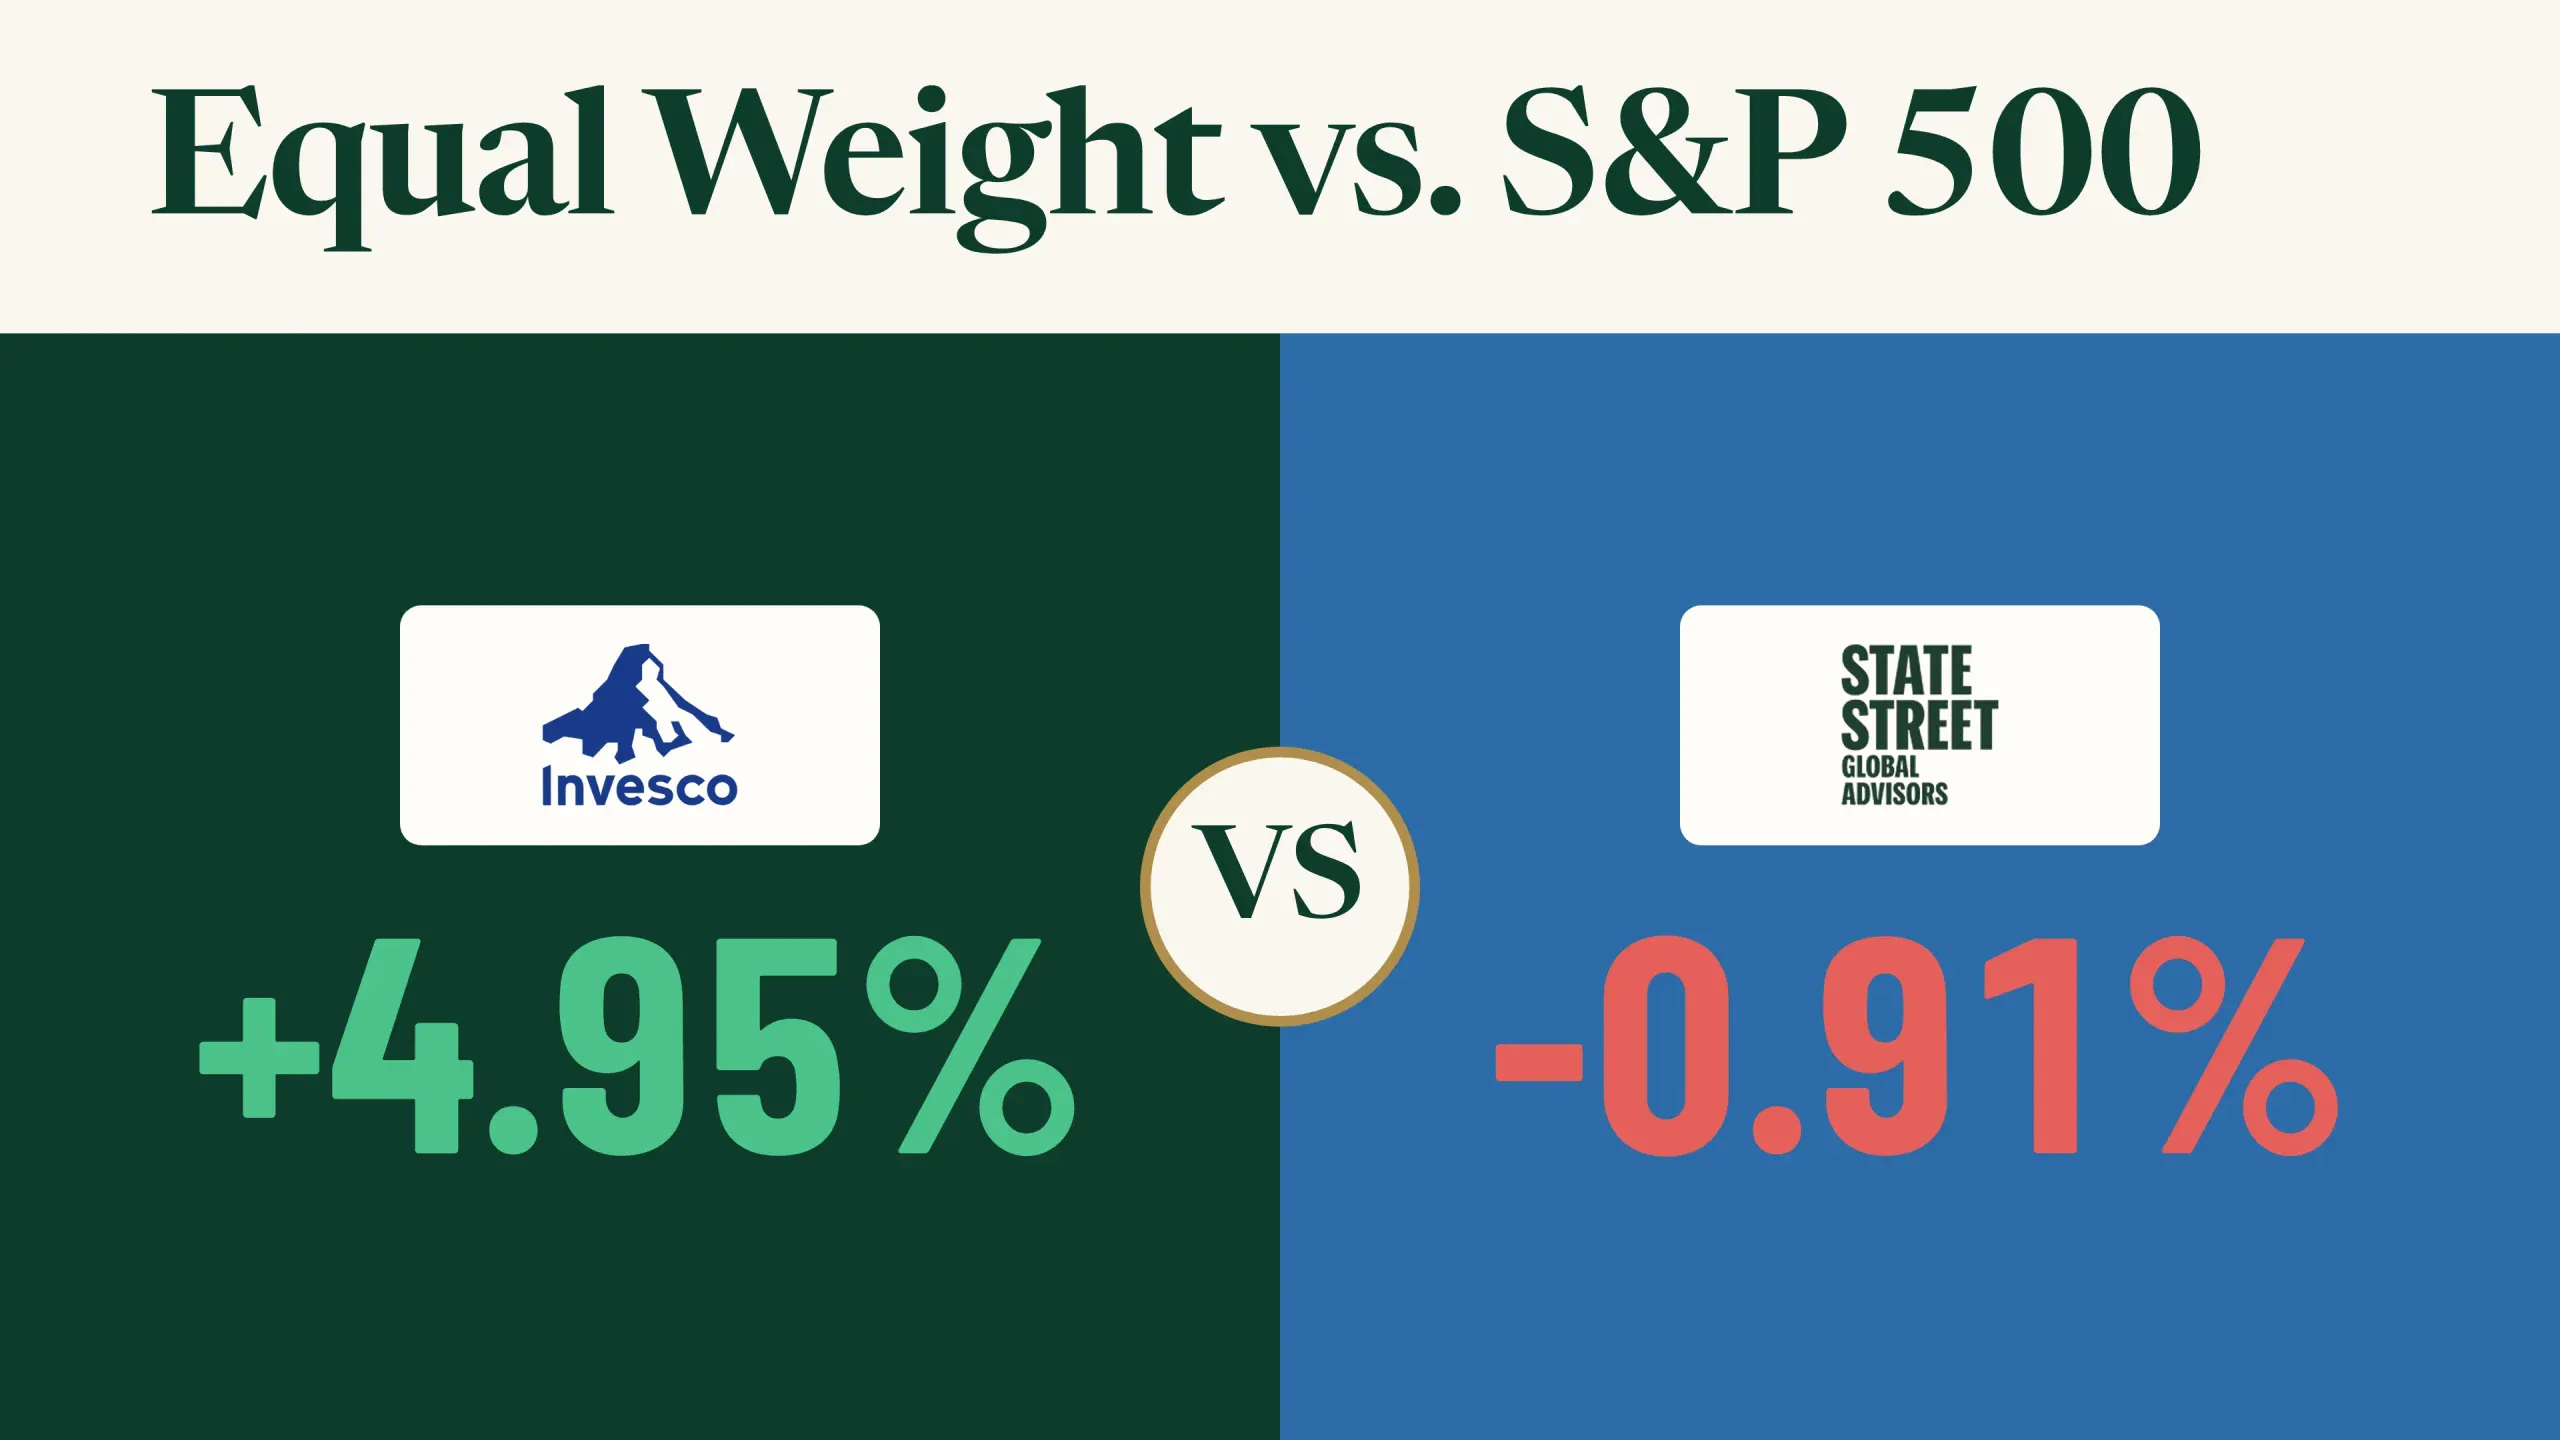 The Average Stock Just Beat the S&P 500 by the Most Since 2009
Your note
Sign in to keep a note on XLK — it syncs with the Stock Master app.