

United Airlines Holdings, Inc. UAL
At closeNov 3, 2026, 5:15 PM EST
After hours · Nov 3, 5:15 PM ET
- YTD
- -4.12%
- 1 year
- +11.55%
- Market cap
- 34.83B
- Revenue (ttm)
- 65.55B
- Profit margin
- 5.46%
- EPS (ttm)
- 10.92
- Shares out
- 324.89M
- P/E ratio
- 9.82
- Forward P/E
- 9.11
- YTD return
- -4.12%
- 1-year return
- +11.55%
- Volume
- 3.94M
- Avg volume
- 4.08M
- Open
- 110.30
- Previous close
- 109.24
- Day's range
- 107.04 – 111.25
- 52-week range
- 84.64 – 138.77
- Beta
- 1.37
- Analysts
- Strong Buy
- Price target
- 149.70 (+39.6%)
- Earnings date
- Jan 19, 2027
2Y +29.96 (+38.78%)
Key statistics
- Enterprise value
- 55.13B
- PEG ratio
- 6.50
- Price / sales
- 0.53
- Price / book
- 1.96
- Dividend yield
- 0.00%
- Payout ratio
- 0.00%
- Revenue growth
- 17.40%
- Free cash flow
- -576.12M
- Total cash
- 14.65B
- Total debt
- 34.29B
- Return on equity
- 22.31%
- Short % of float
- 4.18%
- 50-day average
- 107.57
- 200-day average
- 108.02
Analyst view
Consensus: strong buy
- Target (low)
- 98.00
- Target (mean)
- 149.70
- Target (high)
- 203.00
- Strong buy4
- Buy19
- Hold2
- Sell0
- Strong sell0
Next earnings
Jan 19, 2027
Expected Jan 19, 2027. Consensus EPS estimate 1.32.
Financials — quick view
Earnings
| Report date | Quarter ending | EPS estimate | EPS reported | Surprise | Surprise % |
|---|---|---|---|---|---|
| Jan 19, 2027 | Dec 30, 2026 | 1.24 | — | — | — |
| Oct 20, 2026 | Sep 30, 2026 | 2.57 | 2.54 | -0.03 | -1.17% |
| Jul 15, 2026 | Jun 30, 2026 | 1.88 | 1.99 | +0.11 | +5.85% |
| Apr 21, 2026 | Mar 31, 2026 | 1.08 | 1.19 | +0.11 | +10.19% |
| Jan 20, 2026 | Dec 31, 2025 | 2.93 | 3.10 | +0.17 | +5.80% |
| Oct 15, 2025 | Sep 30, 2025 | 2.65 | 2.78 | +0.13 | +4.91% |
Upgrades / downgrades
| Date | Firm | Action | From | To |
|---|---|---|---|---|
| Oct 22, 2026 | BMO Capital | main | Outperform | Outperform |
| Oct 22, 2026 | Wells Fargo | main | Overweight | Overweight |
| Oct 22, 2026 | Argus Research | main | Buy | Buy |
| Oct 22, 2026 | Susquehanna | main | Positive | Positive |
| Oct 16, 2026 | UBS | main | Buy | Buy |
| Oct 7, 2026 | Susquehanna | main | Positive | Positive |
About United Airlines Holdings, Inc.
United Airlines Holdings, Inc., through its subsidiaries, provides air transportation services in the United States, Canada, Atlantic, the Pacific, and Latin America. It transports people and cargo through its mainline and regional fleets. The company also offers ground handling, flight academy, frequent flyer award non-travel redemptions, and maintenance services for third parties. In addition, it provides freight and mail transportation services to commercial businesses, freight forwarders, logistics firms, and national postal services, as well as loyalty programs. The company distributes its products through direct channels, such as the Company's website and the Company's mobile app; and traditional travel agencies, online travel agencies, and other intermediaries. The company was formerly known as United Continental Holdings, Inc. and changed its name to United Airlines Holdings, Inc. in June 2019. United Airlines Holdings, Inc. was incorporated in 1968 and is based in Chicago, Illinois.
- Sector
- Industrials
- Industry
- Airlines
- Country
- United States
- Website
- united.com
News
 This Midterm Nightmare Scenario Puts S&P 500 Down 10% by Year-End, Evercore Warns
 Here’s How Much You Would Have Made Owning United Airlines Holdings Stock In The Last 5 Years
 JetBlue Soars 11%, United Rallies 6% as Oil Drops on Iran Peace Talk Hopes; American Airlines Gains 5%
 Amazon's Starlink Rival Leo Is Coming This Year: Jassy Says Service Is ‘On Track’
 United & Chef's Table Serve Up Next Course: New Meals from World-Renowned Chefs Take Flight November 1
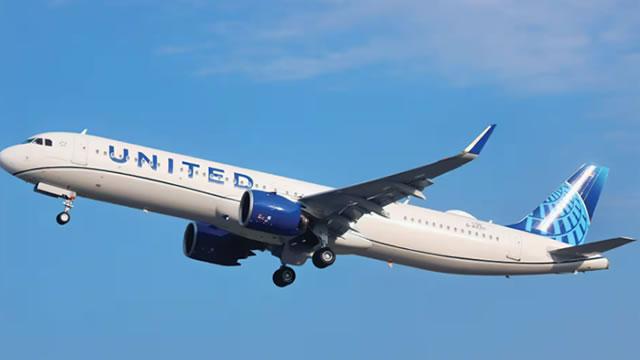 How Should Investors Approach United Airlines Post Q3 Earnings Miss?
 'U.S. Federal Trade Commission Is Demanding Information On Personalized Pricing And Wage Setting Strategies From Walmart, Target, Uber, Lyft, DoorDash, Instacart, Delta, United And JetBlue' - Reuters Exclusive
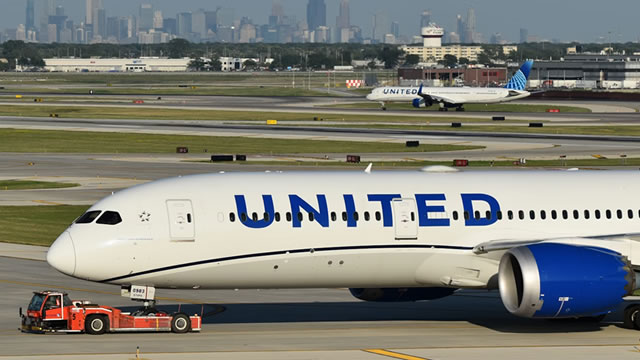 Starlink is fast becoming one of the biggest factors for passengers choosing an airline, United's CEO says
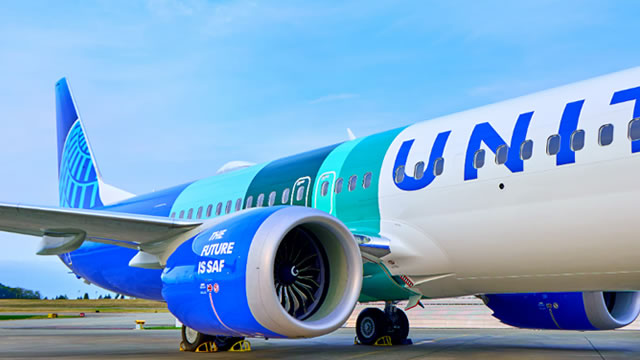 United CEO Scott Kirby says he had an 'epiphany' after hiring an AI tutor and vibe-coding a sports betting tool
 JetBlue Airways Tumbles 16% as Creditors Hire Restructuring Advisers; United Airlines Rises 3%, Delta Edges Higher
Your note
Sign in to keep a note on UAL — it syncs with the Stock Master app.
Insider holders
| Insider | Relation | Latest transaction | Date | Shares held |
|---|---|---|---|---|
| ENQVIST TORBJORN J | Chief Operating Officer | Sale | Jul 23, 2026 | 129,946 |
| GEBO KATE | Officer | Stock Gift | Jul 27, 2026 | 138,036 |
| HARFORD BARNEY | Director | Sale | Aug 11, 2025 | 91,000 |
| HART BRETT J | President | Stock Gift | Jul 27, 2026 | 364,122 |
| JOJO LINDA P | Officer | Sale | Nov 21, 2024 | 63,599 |
| KIRBY JOHN SCOTT | Chief Executive Officer | Stock Award(Grant) | Jul 23, 2026 | 854,122 |
Institution ownership
| Holder | % held | Shares | Value | Reported |
|---|---|---|---|---|
| Blackrock Inc. | 8.41% | 22,436,107 | 2.41B | Jun 29, 2026 |
| Vanguard Capital Management LLC | 7.88% | 21,008,797 | 2.25B | Jun 29, 2026 |
| FMR, LLC | 7.30% | 19,473,813 | 2.09B | Jun 29, 2026 |
| Primecap Management Company | 6.17% | 16,461,630 | 1.76B | Jun 29, 2026 |
| Sanders Capital, LLC | 5.66% | 15,090,502 | 1.62B | Sep 29, 2026 |
| Vanguard Portfolio Management LLC | 5.31% | 14,162,813 | 1.52B | Jun 29, 2026 |
Fund ownership
| Holder | % held | Shares | Value | Reported |
|---|---|---|---|---|
| Growth Fund of America | 5.90% | 15,738,855 | 1.69B | Sep 29, 2026 |
| VANGUARD INDEX FUNDS-Vanguard Total Stock Market Index Fund | 3.86% | 10,305,622 | 1.10B | Jun 29, 2026 |
| VANGUARD CHESTER FUNDS-Vanguard PRIMECAP Fund | 3.34% | 8,904,603 | 954.66M | Jun 29, 2026 |
| VANGUARD INDEX FUNDS-Vanguard 500 Index Fund | 3.15% | 8,409,887 | 901.62M | Jun 29, 2026 |
| VANGUARD INDEX FUNDS-Vanguard Mid-Cap Index Fund | 2.64% | 7,034,476 | 754.17M | Jun 29, 2026 |
| iShares Trust-iShares Core S&P 500 ETF | 1.62% | 4,324,876 | 463.67M | Sep 29, 2026 |