

iShares 20+ Year Treasury Bond ETF TLT
81.11 USD -0.62 (-0.76%)
At closeNov 3, 2026, 4:00 PM EST
81.50 +0.39 +0.48%
After hours · Nov 3, 4:00 PM ET
80.97 Day range 81.45
76.43 52-week range 90.86
- YTD
- -6.94%
- 1 year
- -9.62%
- Market cap
- 47.48B
- EPS (ttm)
- -12.59
- Forward P/E
- -4055.50
- YTD return
- -6.94%
- 1-year return
- -9.62%
- Volume
- 28.99M
- Avg volume
- 39.11M
- Open
- 81.44
- Previous close
- 81.73
- Day's range
- 80.97 – 81.45
- 52-week range
- 76.43 – 90.86
2Y -11.14 (-12.08%)
Key statistics
- Enterprise value
- 0
- PEG ratio
- 0.00
- Price / sales
- 0.00
- Price / book
- 0.00
- Dividend yield
- 0.00%
- Payout ratio
- 0.00%
- Revenue growth
- 0.00%
- Free cash flow
- 0
- Total cash
- 0
- Total debt
- 0
- Return on equity
- 0.00%
- Short % of float
- 0.00%
- 50-day average
- 80.49
- 200-day average
- 84.59
Next earnings
Consensus EPS estimate 0.00.
About iShares 20+ Year Treasury Bond ETF
The underlying index consists of publicly-issued U.S. Treasury securities that have a remaining maturity greater than twenty years and have $300 million or more of outstanding face value, excluding amounts held by the Federal Reserve System (the “Fed”). The fund will invest at least 80% of its assets in the component securities of the underlying index, and the fund will invest at least 90% of its assets in U.S. Treasury securities that manager believes will help the fund track the underlying index.
News
 Could Midterm Elections Solve Washington's $1.36 Trillion Interest Bill?
 The U.S. Just Borrowed a Record $839 Billion in One Week
 The 10-Year Treasury Yield Just Jumped Back Above 5%
 The Fed Is Cutting Back on Rate Votes for the First Time Since 1981
 Kevin Warsh Plans Fewer Fed Rate Decisions as Central Bank Sets Aside Meetings for Long-Term Strategy — Rate Votes Drop to Six by 2028
 Beyond the Fed’s Pause: Savers Win, Borrowers Pay, and Oil Fuels the Dollar
 India bonds seen attracting buyers as 10-year yield nears 2022 levels
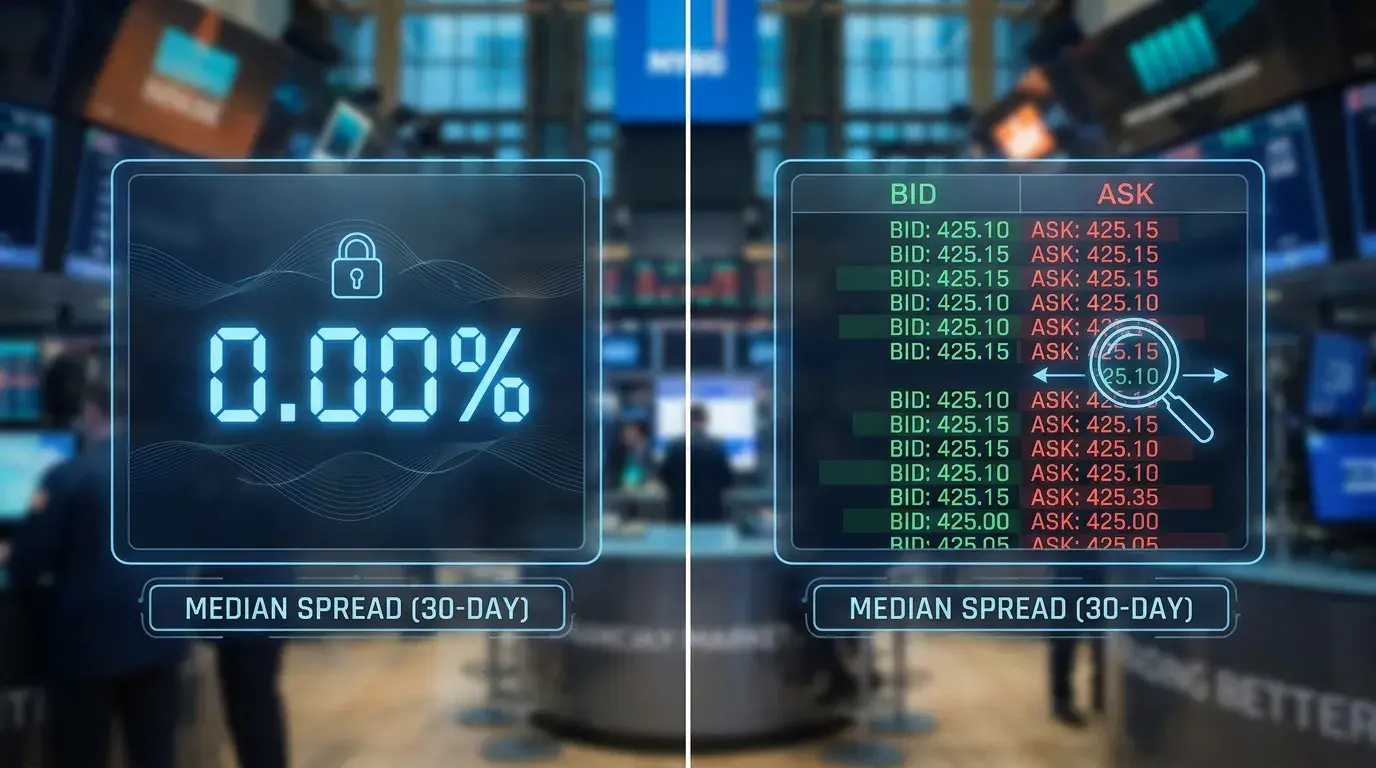 Your ETF’s Spread Looks Like Zero. Here’s What That Number Doesn’t Tell You
 Fed Holds Rate at 3.75%-4%, Two Officials Push for a Hike (UPDATED)
 Fed May Hold Rates Today, But Bond ETFs Face a Bigger Test Ahead
Your note
Sign in to keep a note on TLT — it syncs with the Stock Master app.