

Sun Communities, Inc. SUI
Regular-session close
After hours · Nov 19, 5:55 PM ET
- YTD
- -7.34%
- 1 year
- -8.52%
- Market cap
- 14.25B
- Revenue (ttm)
- 2.34B
- Profit margin
- -32.48%
- EPS (ttm)
- 2.45
- Shares out
- 119.37M
- P/E ratio
- 46.87
- Forward P/E
- 37.98
- Dividend
- 4.48 (3.83%)
- Ex-dividend date
- Sep 30, 2026
- YTD return
- -7.34%
- 1-year return
- -8.52%
- Volume
- 933.32K
- Avg volume
- 1.21M
- Open
- 115.25
- Previous close
- 116.83
- Day's range
- 113.51 – 117.02
- 52-week range
- 109.77 – 137.85
- Beta
- 0.74
- Analysts
- Buy
- Price target
- 134.95 (+17.5%)
- Earnings date
- Feb 23, 2027
- 50-day average
- 115.39
Key statistics
- 200-day average
- 122.94
- Enterprise value
- 17.12B
- PEG ratio
- 9.42
- Price / sales
- 6.10
- Price / book
- 2.64
- Payout ratio
- 179.59%
- Revenue growth
- 0.80%
- Free cash flow
- 1.64B
- Total cash
- 699.30M
- Total debt
- 3.80B
- Return on equity
- 4.89%
- Short % of float
- 8.28%
Fundamental scorecard
8 of 25 checks passed on SUI’s reported financials
8of 25 checks passed
- Value 1 of 5
- Growth 4 of 5
- Profitability 0 of 5
- Financial health 0 of 5
- Dividend 3 of 5
Statements to Sep 30, 2026.
Analyst view
Consensus: buy
- Target (low)
- 116.00
- Target (mean)
- 134.95
- Target (high)
- 155.00
- Strong buy5
- Buy9
- Hold5
- Sell0
- Strong sell0
Next earnings
Feb 23, 2027
Expected Feb 23, 2027. Consensus EPS estimate 0.4037.
Financials — quick view
Earnings
| Report date | Quarter ending | EPS estimate | EPS reported | Surprise | Surprise % |
|---|---|---|---|---|---|
| Feb 23, 2027 | Dec 30, 2026 | 0.4288 | — | — | — |
| Oct 26, 2026 | Sep 30, 2026 | 1.25 | 1.00 | -0.25 | -20.00% |
| Jul 27, 2026 | Jun 30, 2026 | 0.662 | 8.06 | +7.40 | +1,117.52% |
| Apr 27, 2026 | Mar 31, 2026 | 0.2656 | -0.07 | -0.34 | -126.36% |
| Feb 24, 2026 | Dec 31, 2025 | 0.3913 | 0.99 | +0.60 | +153.00% |
| Oct 29, 2025 | Sep 30, 2025 | 2.18 | 0.07 | -2.11 | -96.79% |
Upgrades / downgrades
| Date | Firm | Action | From | To |
|---|---|---|---|---|
| Nov 10, 2026 | Baird | main | Neutral | Neutral |
| Nov 3, 2026 | Truist Securities | main | Buy | Buy |
| Nov 2, 2026 | Evercore ISI Group | main | Outperform | Outperform |
| Oct 28, 2026 | Evercore ISI Group | main | Outperform | Outperform |
| Oct 19, 2026 | Wells Fargo | main | Overweight | Overweight |
| Oct 14, 2026 | Barclays | main | Overweight | Overweight |
About Sun Communities, Inc.
Sun Communities, Inc. became a publicly owned corporation in December 1993. The Company is a fully integrated REIT listed on the New York Stock Exchange under the symbol: SUI. As of June 30, 2026, the Company owned, operated, or had an interest in a portfolio of 455 developed MH and RV properties comprising approximately 156,130 developed sites in the U.S. and Canada. At that date, the Company also owned, operated, or held an interest in a portfolio of 54 U.K. properties comprising approximately 22,030 developed sites, which were classified within discontinued operations as of June 30, 2026. Sun Communities, Inc. was incorporated in 1975 in Maryland and is based in Southfield, Michigan.
- Sector
- Real Estate
- Industry
- REIT - Residential
- Country
- United States
- Website
- suncommunities.com
News
 Sun Communities: Opportunity To Buy Quality Real Estate On Sale
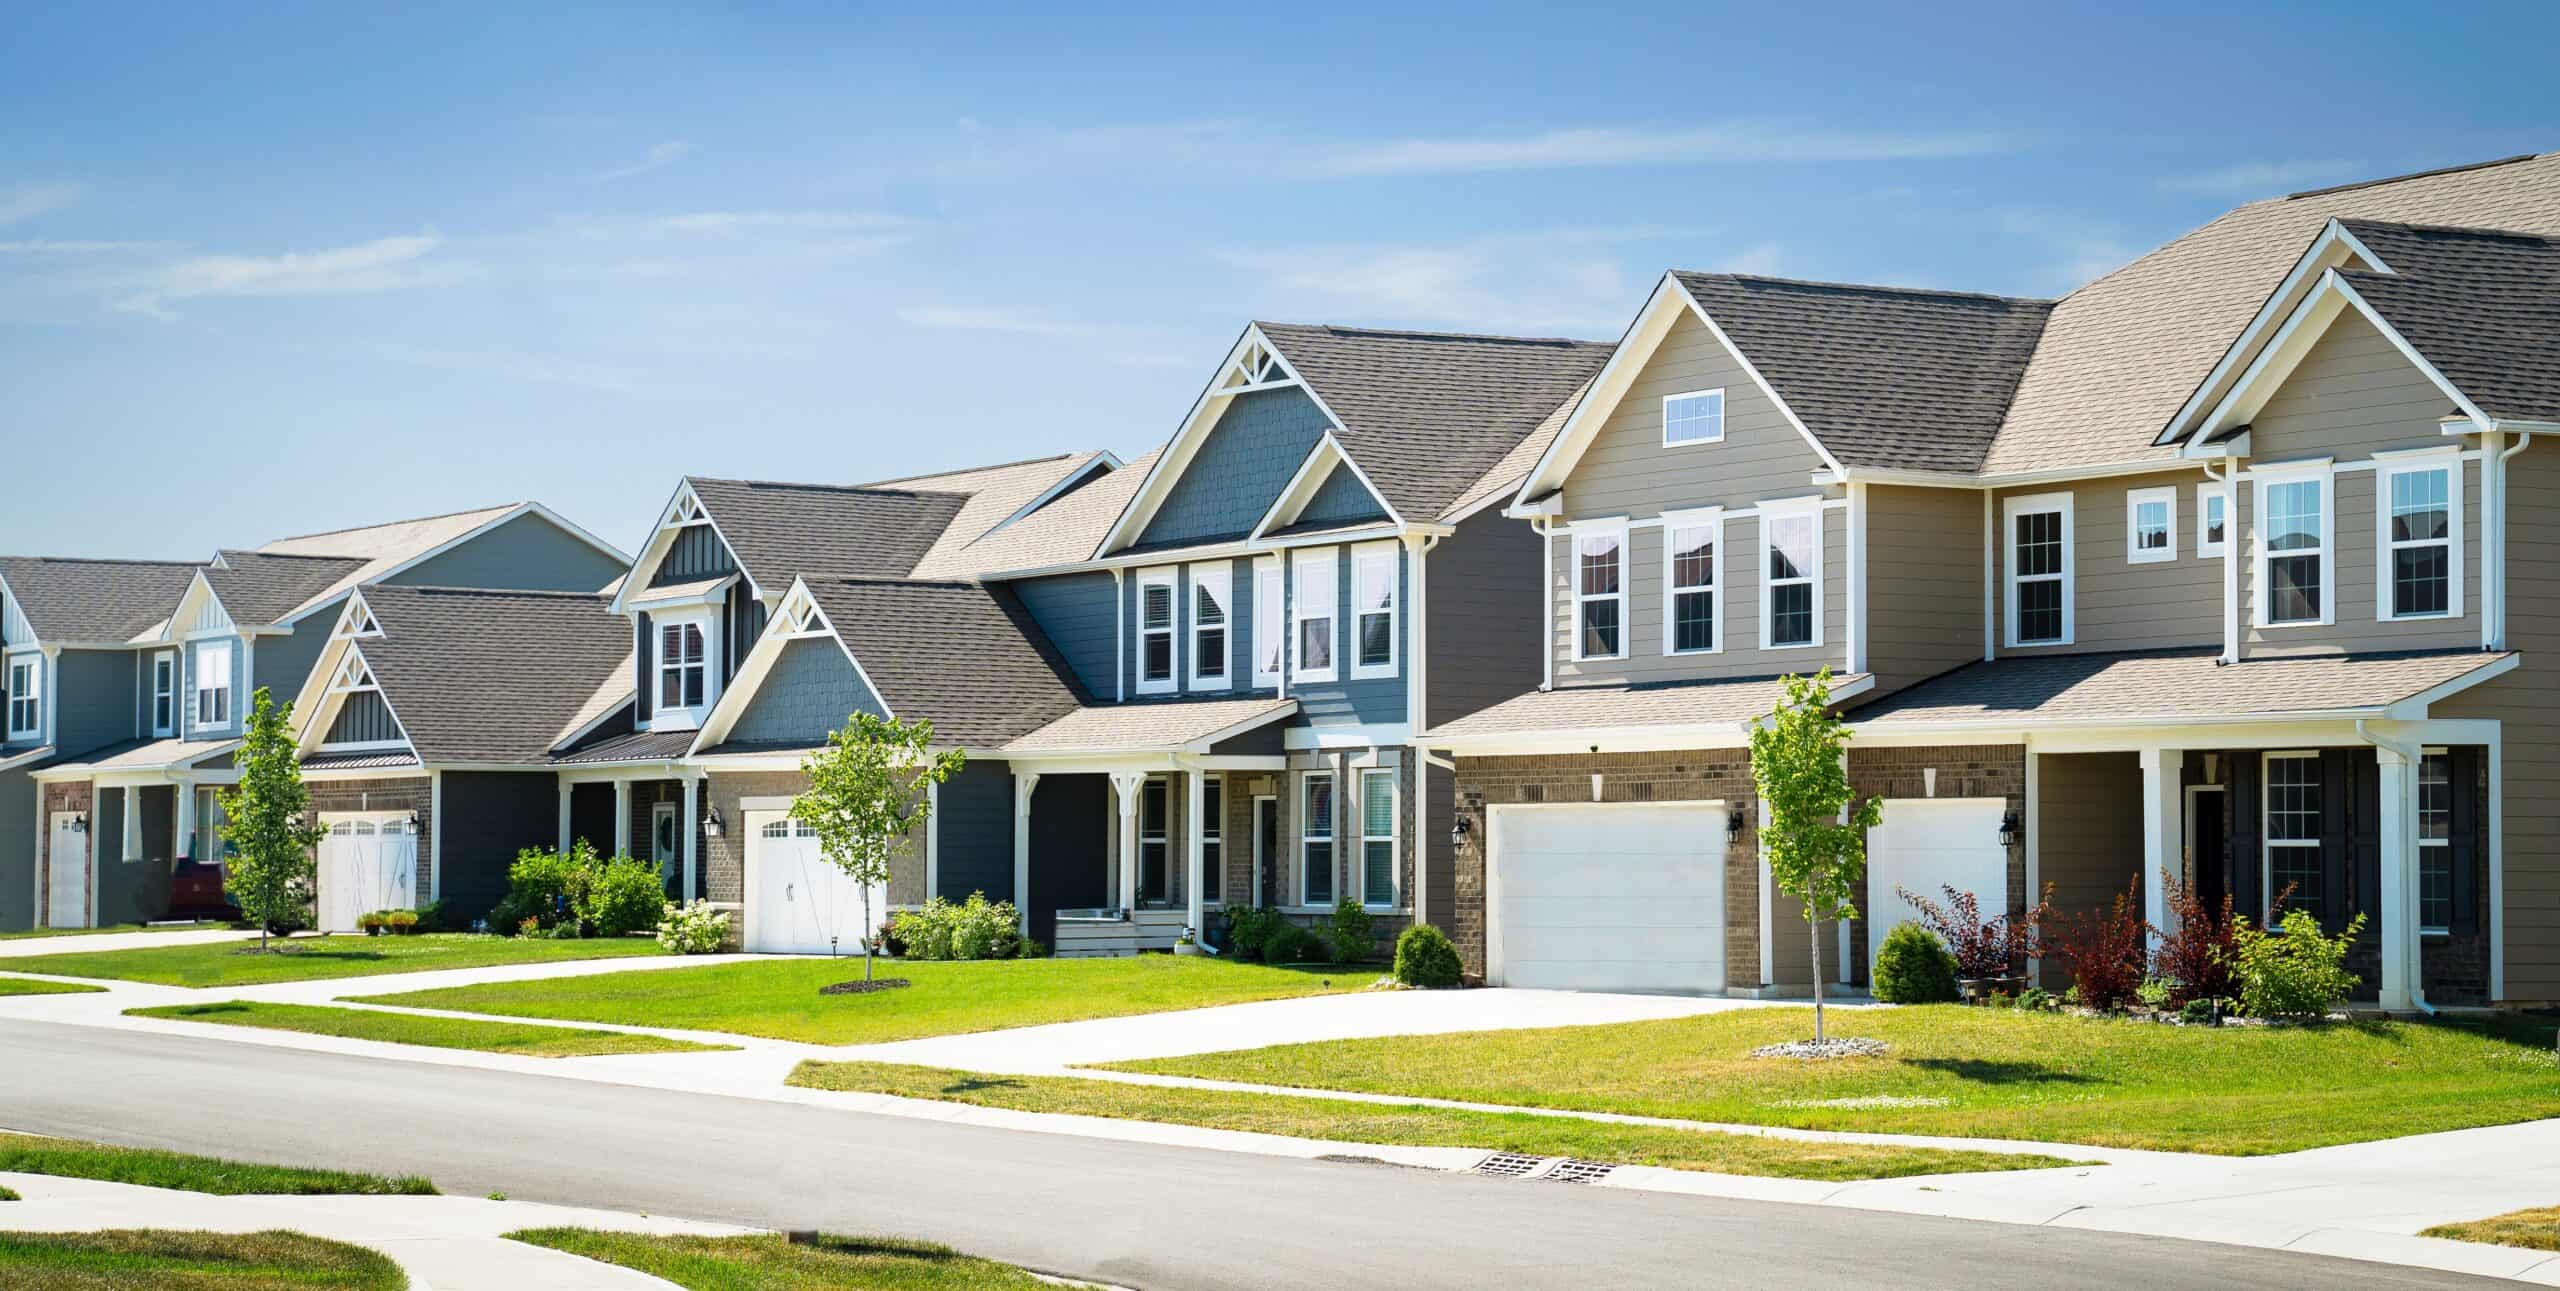 Housing Costs Keep Buyers Renting, and $90,000 Across These 3 Housing REITs Pays $3,522 a Year
 Which Cryptocurrencies Under $1 Could Take Off in 2027?
 Bitcoin Gained 7% in September, but NEAR and Arbitrum Reportedly Surged 187% and 137%
 Baird Maintains Neutral on Sun Communities, Lowers Price Target to $131
 SUI Group Holdings Limited (SUIG) Q3 2026 Earnings Call Transcript
 Sun Communities: 3 Key Takeaways for Long-Term Investors
 Truist Securities Maintains Buy on Sun Communities, Lowers Price Target to $129
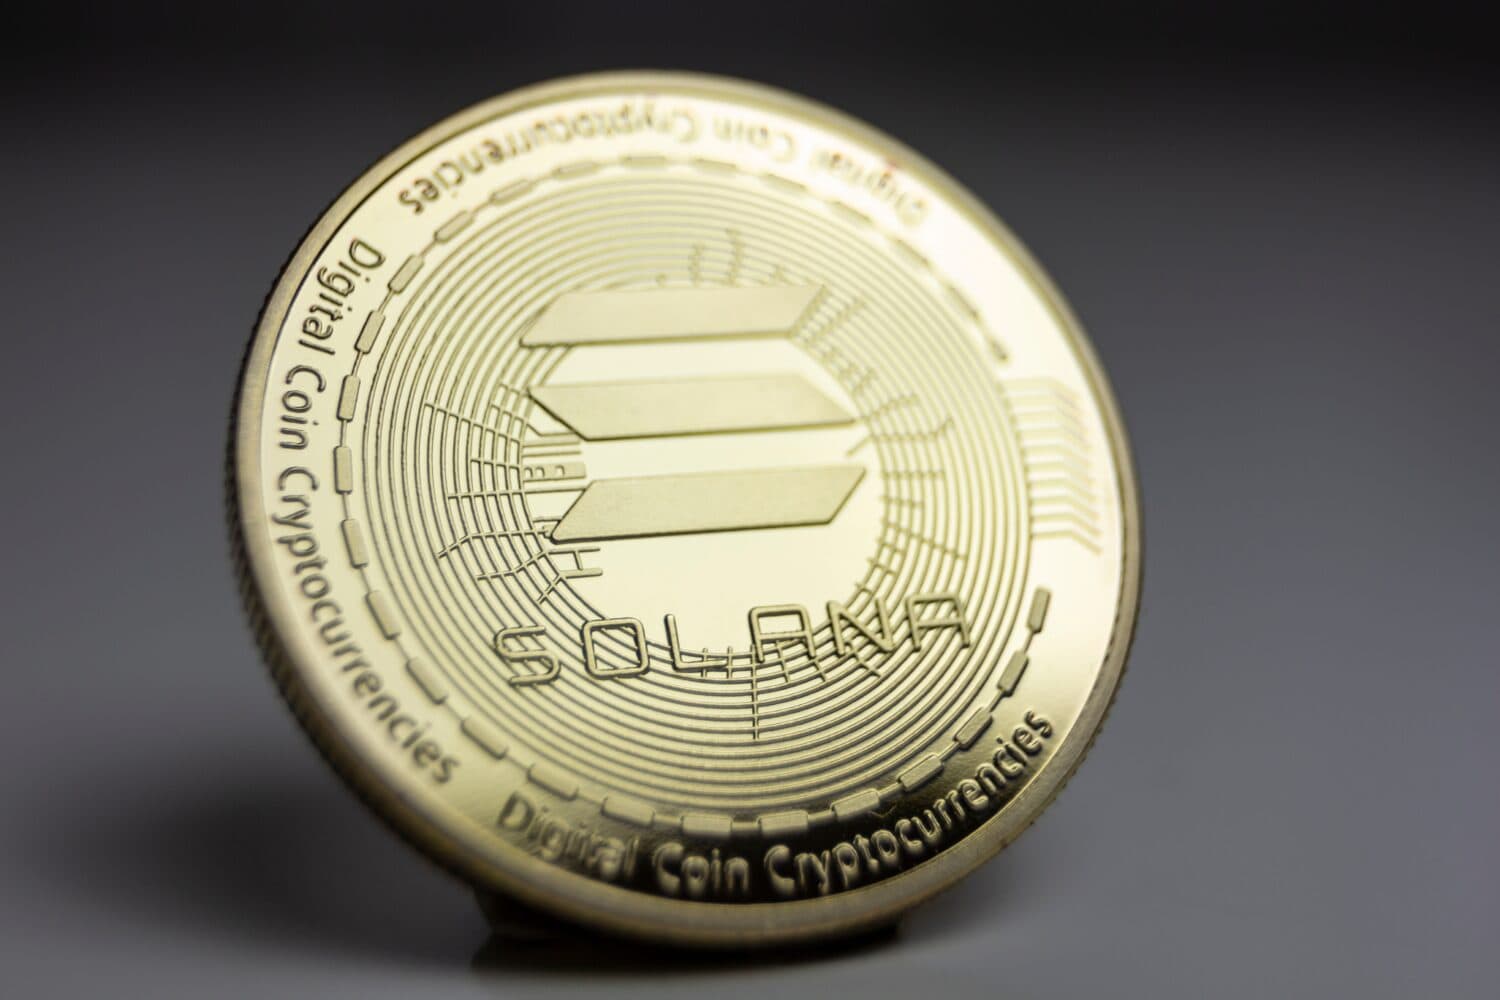 10,000 Sui or 100 Solana: Which Could Be Worth More by 2028?
 Evercore ISI Group Maintains Outperform on Sun Communities, Lowers Price Target to $135
Your note
Sign in to keep a note on SUI — it syncs with the Stock Master app.
Insider holders
| Insider | Relation | Latest transaction | Date | Shares held |
|---|---|---|---|---|
| BAIVIER MEGHAN G | Director | Stock Award(Grant) | Feb 4, 2026 | 19,417 |
| BERGERON STEPHANIE W | Director | Stock Award(Grant) | Jan 7, 2025 | 26,700 |
| FARRUGIA MARC | Officer | Stock Award(Grant) | Mar 26, 2026 | 63,514 |
| HERMELIN BRIAN M | Director | Stock Award(Grant) | Feb 4, 2026 | 28,327 |
| MCLAREN JOHN BANDINI | President | Stock Gift | May 25, 2026 | 75,528 |
| PATTEN MARK E | Chief Financial Officer | Stock Award(Grant) | Jan 4, 2026 | 28,892 |
Institution ownership
| Holder | % held | Shares | Value | Reported |
|---|---|---|---|---|
| Blackrock Inc. | 16.47% | 19,654,567 | 2.26B | Sep 29, 2026 |
| Cohen & Steers Inc. | 12.43% | 14,833,875 | 1.70B | Sep 29, 2026 |
| Vanguard Portfolio Management LLC | 8.69% | 10,368,219 | 1.19B | Sep 29, 2026 |
| State Street Corporation | 5.63% | 6,723,443 | 772.73M | Sep 29, 2026 |
| Price (T.Rowe) Associates Inc | 4.73% | 5,647,015 | 649.01M | Sep 29, 2026 |
| Vanguard Capital Management LLC | 4.57% | 5,458,513 | 627.35M | Sep 29, 2026 |
Fund ownership
| Holder | % held | Shares | Value | Reported |
|---|---|---|---|---|
| Dodge & Cox Funds-Dodge & Cox Stock Fund | 5.88% | 7,021,300 | 806.96M | Jun 29, 2026 |
| VANGUARD SPECIALIZED FUNDS-Vanguard Real Estate Index Fund | 3.93% | 4,687,726 | 538.76M | Jul 30, 2026 |
| iShares Trust-iShares Core S&P Mid-Cap ETF | 3.63% | 4,338,587 | 498.63M | Sep 29, 2026 |
| VANGUARD INDEX FUNDS-Vanguard Total Stock Market Index Fund | 3.28% | 3,909,630 | 449.33M | Jun 29, 2026 |
| VANGUARD FENWAY FUNDS-Vanguard Equity Income Fund | 3.12% | 3,724,582 | 428.07M | Jun 29, 2026 |
| VANGUARD INDEX FUNDS-Vanguard Small-Cap Index Fund | 2.37% | 2,825,670 | 324.75M | Jun 29, 2026 |