

STAG Industrial, Inc. STAG
35.98 USD -0.18 (-0.50%)
Regular-session close
35.98 0.00 0.00%
After hours · Nov 20, 4:00 PM ET
35.92 Day range 36.85
35.14 52-week range 42.61
- YTD
- -2.12%
- 1 year
- -6.11%
5D -0.51 (-1.37%)
- Market cap
- 7.08B
- Revenue (ttm)
- 900.52M
- Profit margin
- 29.88%
- EPS (ttm)
- 1.41
- Shares out
- 192.82M
- P/E ratio
- 25.52
- Forward P/E
- 40.90
- Dividend
- 1.55 (4.29%)
- Ex-dividend date
- Dec 31, 2026
- YTD return
- -2.12%
- 1-year return
- -6.11%
- Volume
- 1.13M
- Avg volume
- 1.50M
- Open
- 36.21
- Previous close
- 36.16
- Day's range
- 35.92 – 36.85
- 52-week range
- 35.14 – 42.61
- Beta
- 0.92
- Analysts
- Buy
- Price target
- 41.25 (+14.6%)
- Earnings date
- Feb 10, 2027
- 50-day average
- 36.65
Key statistics
- 200-day average
- 37.85
- Enterprise value
- 10.46B
- PEG ratio
- 19.49
- Price / sales
- 7.86
- Price / book
- 1.90
- Payout ratio
- 108.87%
- Revenue growth
- 9.40%
- Free cash flow
- 468.64M
- Total cash
- 50.83M
- Total debt
- 3.46B
- Return on equity
- 7.60%
- Short % of float
- 5.17%
Fundamental scorecard
11 of 25 checks passed on STAG’s reported financials
11of 25 checks passed
- Value 2 of 5
- Growth 3 of 5
- Profitability 3 of 5
- Financial health 0 of 5
- Dividend 3 of 5
Statements to Sep 30, 2026.
Analyst view
Consensus: buy
Buy
Price target (mean) 41.25 +14.6% upside
Now 35.98
- Target (low)
- 39.00
- Target (mean)
- 41.25
- Target (high)
- 44.00
Ratings (0m) 12 5 buy · 6 hold · 1 sell
- Strong buy1
- Buy4
- Hold6
- Sell0
- Strong sell1
Next earnings
Feb 10, 2027
Expected Feb 10, 2027. Consensus EPS estimate 0.27.
Financials — quick view
STAG Revenue — quarterly 231.04M
STAG Net income — quarterly 70.71M
STAG EPS — quarterly 0.37
Earnings
| Report date | Quarter ending | EPS estimate | EPS reported | Surprise | Surprise % |
|---|---|---|---|---|---|
| Feb 10, 2027 | Dec 30, 2026 | 0.2512 | — | — | — |
| Oct 27, 2026 | Sep 30, 2026 | 0.2721 | 0.37 | +0.10 | +35.98% |
| Jul 28, 2026 | Jun 30, 2026 | 0.2702 | 0.28 | +0.01 | +3.63% |
| Apr 28, 2026 | Mar 31, 2026 | 0.2267 | 0.32 | +0.09 | +41.16% |
| Feb 11, 2026 | Dec 31, 2025 | 0.2244 | 0.44 | +0.22 | +96.08% |
| Oct 29, 2025 | Sep 30, 2025 | 0.2565 | 0.26 | 0.00 | +1.36% |
Upgrades / downgrades
| Date | Firm | Action | From | To |
|---|---|---|---|---|
| Nov 16, 2026 | Wells Fargo | main | Equal-Weight | Equal-Weight |
| Oct 29, 2026 | Citigroup | main | Neutral | Neutral |
| Sep 21, 2026 | Evercore ISI Group | main | Outperform | Outperform |
| Sep 14, 2026 | Evercore ISI Group | main | Outperform | Outperform |
| Sep 1, 2026 | Wells Fargo | main | Equal-Weight | Equal-Weight |
| Aug 31, 2026 | Baird | up | Neutral | Outperform |
About STAG Industrial, Inc.
STAG Industrial, Inc. is a real estate investment trust focused on the acquisition, development, ownership and operation of industrial properties throughout the United States. As of June 30, 2026, the Company's portfolio consists of 606 buildings in 41 states with approximately 122.6 million rentable square feet. STAG Industrial, Inc. was established in 2010 and was incorporated in Maryland.
- Sector
- Real Estate
- Industry
- REIT - Industrial
- Country
- United States
- Website
- stagindustrial.com
News
 4 Monthly Dividend Stocks That Pay Roth IRA Investors Tax-Free Every Month
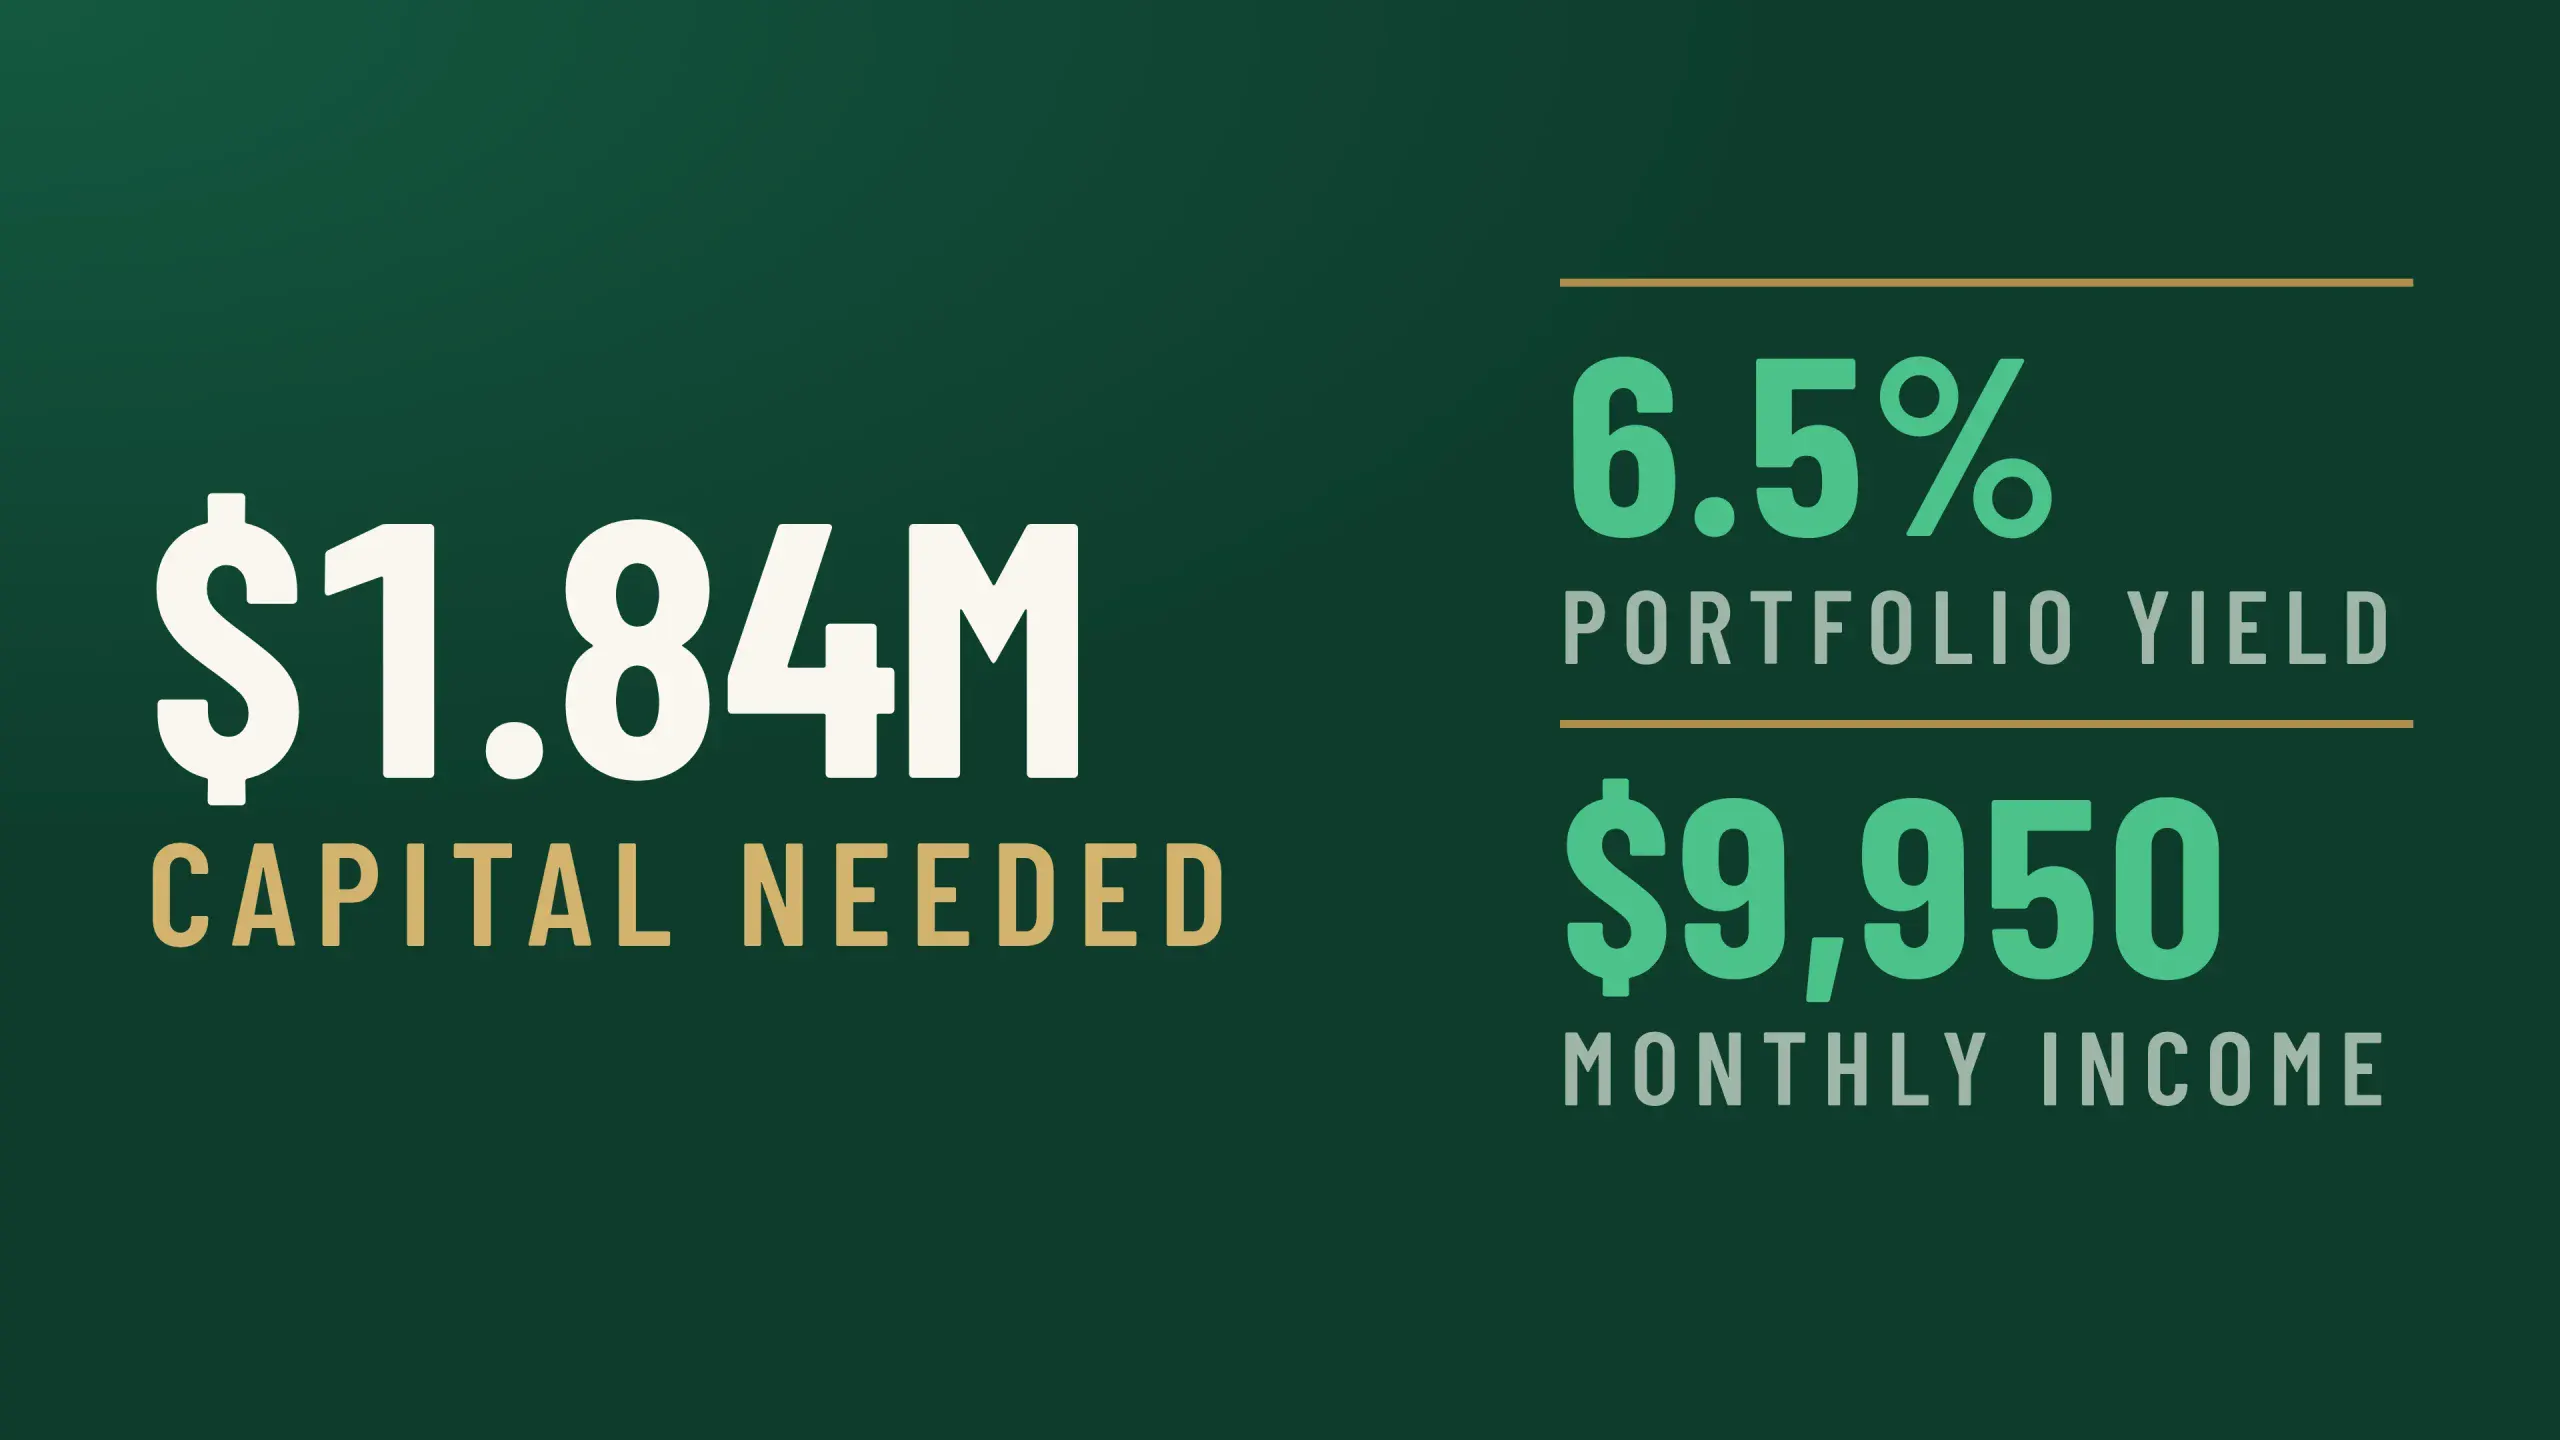 How to Build $9,950 a Month in Dividend Income Without Owning a Single Bond or Selling a Single Share
 $615,000 to Invest at 65: What an Annuity Pays vs. What a Dividend Portfolio Pays, Month by Month
 Invest $75,000 in These 5 High-Yield Stocks and Collect Monthly Income in Retirement
 Wells Fargo Maintains Equal-Weight on Stag Industrial, Raises Price Target to $39
 STAG: 3 Key Takeaways for Long-Term Investors
- Citigroup Maintains Neutral on Stag Industrial, Lowers Price Target to $39
 Stag Industrial Q3 2026 Earnings Call Transcript
 Stag Industrial Q3 FFO $0.66, Inline, Sales $230.970M Beat $227.626M Estimate
Your note
Sign in to keep a note on STAG — it syncs with the Stock Master app.
Insider holders
| Insider | Relation | Latest transaction | Date | Shares held |
|---|---|---|---|---|
| BUTCHER BENJAMIN S. | Director | Stock Award(Grant) | Jul 14, 2026 | 9,305 |
| CHASE MICHAEL C | Chief Investment Officer | Sale | Nov 4, 2025 | 9,422 |
| CHIN JIT KEE | Director | Stock Award(Grant) | Jul 14, 2026 | 11,633 |
| COLBERT VIRGIS W | Director | Stock Award(Grant) | Oct 14, 2026 | 5,518 |
| DILLEY MICHELLE | Director | Stock Award(Grant) | Jul 14, 2026 | 14,553 |
| FURBER JEFFREY DAVIS | Director | Stock Award(Grant) | Jul 14, 2026 | 55,544 |
Institution ownership
| Holder | % held | Shares | Value | Reported |
|---|---|---|---|---|
| Blackrock Inc. | 14.21% | 27,400,663 | 986.15M | Sep 29, 2026 |
| Vanguard Portfolio Management LLC | 8.94% | 17,233,988 | 620.25M | Sep 29, 2026 |
| FMR, LLC | 6.00% | 11,577,590 | 416.68M | Sep 29, 2026 |
| State Street Corporation | 4.88% | 9,403,520 | 338.43M | Sep 29, 2026 |
| Vanguard Capital Management LLC | 4.49% | 8,659,407 | 311.65M | Sep 29, 2026 |
| NORGES BANK | 4.15% | 8,006,493 | 288.15M | Jun 29, 2026 |
Fund ownership
| Holder | % held | Shares | Value | Reported |
|---|---|---|---|---|
| VANGUARD SPECIALIZED FUNDS-Vanguard Real Estate Index Fund | 3.77% | 7,272,247 | 261.73M | Jul 30, 2026 |
| iShares Trust-iShares Core S&P Mid-Cap ETF | 3.56% | 6,870,229 | 247.26M | Sep 29, 2026 |
| VANGUARD INDEX FUNDS-Vanguard Total Stock Market Index Fund | 3.15% | 6,074,826 | 218.63M | Jun 29, 2026 |
| VANGUARD INDEX FUNDS-Vanguard Small-Cap Index Fund | 2.27% | 4,386,598 | 157.87M | Jun 29, 2026 |
| VANGUARD INDEX FUNDS-Vanguard Small-Cap Value Index Fund | 1.44% | 2,777,780 | 99.97M | Jun 29, 2026 |
| VANGUARD INDEX FUNDS-Vanguard Extended Market Index Fund | 1.14% | 2,192,762 | 78.92M | Jun 29, 2026 |