

Invesco NASDAQ 100 ETF QQQM
282.23 USD +1.74 (+0.62%)
At closeNov 3, 2026, 7:59 PM EST
280.64 -1.59 -0.56%
After hours · Nov 3, 7:59 PM ET
281.31 Day range 283.54
228.75 52-week range 314.12
- YTD
- +11.59%
- 1 year
- +8.45%
- Market cap
- 75.69B
- EPS (ttm)
- 10.76
- P/E ratio
- 26.24
- YTD return
- +11.59%
- 1-year return
- +8.45%
- Volume
- 4.40M
- Avg volume
- 2.93M
- Open
- 281.73
- Previous close
- 280.49
- Day's range
- 281.31 – 283.54
- 52-week range
- 228.75 – 314.12
3M -15.80 (-5.30%)
Key statistics
- Enterprise value
- 0
- PEG ratio
- 0.00
- Price / sales
- 0.00
- Price / book
- 0.00
- Dividend yield
- 0.00%
- Payout ratio
- 0.00%
- Revenue growth
- 0.00%
- Free cash flow
- 0
- Total cash
- 0
- Total debt
- 0
- Return on equity
- 0.00%
- Short % of float
- 0.00%
- 50-day average
- 298.26
- 200-day average
- 279.91
Next earnings
Consensus EPS estimate 0.00.
About Invesco NASDAQ 100 ETF
The fund generally will invest at least 90% of its total assets in the securities that comprise the underlying index. The underlying index weights its component securities using a “modified market capitalization-weighted” methodology, which takes into account the market value of the component securities subject to certain weight restrictions pursuant to the index provider’s methodology. It is non-diversified.
News
 If You'd Put $3,000 Into QQQM 5 Years Ago, Here's What You'd Have Now
 Invesco NASDAQ 100 ETF $QQQM Stake Cut by bLong Financial LLC
 QQQM: The Nasdaq 100 Is Having A Panic Attack And I Think This Pullback Should Be Bought
 Would An AI Stock Crash Be as Bad as 2008? Here's What "Big Short" Investor Steve Eisman Says.
 Invesco NASDAQ 100 ETF $QQQM Stake Lifted by CPR Investments Inc.
 Forget QQQ: The Company Behind It Runs the Same Index for $30 Less a Year on a $100K Balance
 Invesco NASDAQ 100 ETF $QQQM Stock Bought by Kingswood Wealth Advisors LLC
 EXCLUSIVE: A SpaceX–Tesla Merger Could Boost Passive ETF Demand, But ERShares’ Joel Shulman Flags a Big Risk
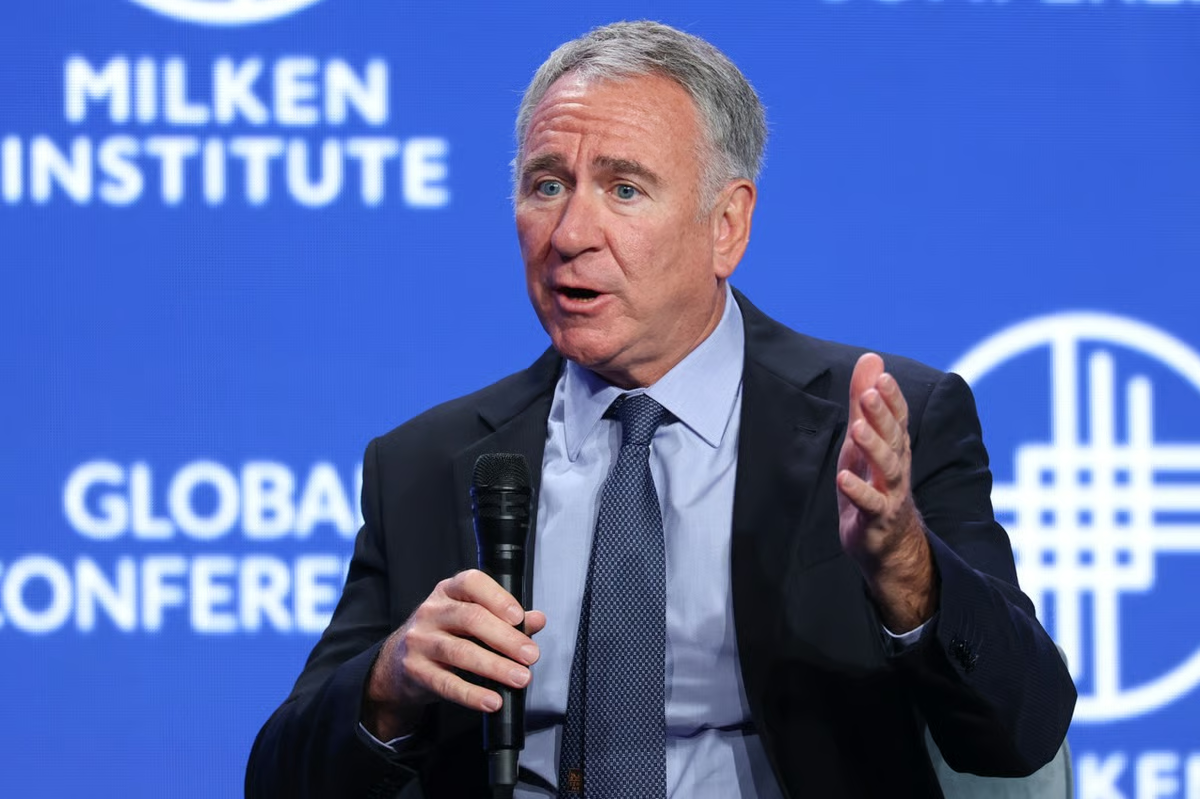 Billionaire Ken Griffin Says There Is "Almost Certainly" an AI Bubble Right Now
 Invesco NASDAQ 100 ETF $QQQM Shares Acquired by Brookstone Capital Management
Your note
Sign in to keep a note on QQQM — it syncs with the Stock Master app.