

National Health Investors, Inc. NHI
As ofNov 19, 2026, 12:32 PM EST
- YTD
- -19.21%
- 1 year
- -20.73%
5D -7.29 (-10.54%)
- Market cap
- 3.03B
- Revenue (ttm)
- 459.42M
- Profit margin
- 151.81%
- EPS (ttm)
- 14.32
- Shares out
- 49.11M
- P/E ratio
- 4.31
- Forward P/E
- 20.31
- Dividend
- 3.76 (6.19%)
- Ex-dividend date
- Dec 31, 2026
- YTD return
- -19.21%
- 1-year return
- -20.73%
- Volume
- 94.51K
- Avg volume
- 351.88K
- Open
- 62.00
- Previous close
- 62.43
- Day's range
- 61.37 – 62.72
- 52-week range
- 59.05 – 91.38
- Beta
- 0.53
- Analysts
- Buy
- Price target
- 74.25 (+20.3%)
- Earnings date
- Feb 25, 2027
- 50-day average
- 66.86
Key statistics
- 200-day average
- 75.60
- Enterprise value
- 3.96B
- PEG ratio
- 4.76
- Price / sales
- 6.58
- Price / book
- 1.45
- Payout ratio
- 25.84%
- Revenue growth
- 26.30%
- Free cash flow
- -24.26M
- Total cash
- 46.56M
- Total debt
- 1.04B
- Return on equity
- 38.61%
- Short % of float
- 4.64%
Fundamental scorecard
14 of 25 checks passed on NHI’s reported financials
14of 25 checks passed
- Value 4 of 5
- Growth 2 of 5
- Profitability 4 of 5
- Financial health 1 of 5
- Dividend 3 of 5
Statements to Sep 30, 2026.
Analyst view
Consensus: buy
- Target (low)
- 65.00
- Target (mean)
- 74.25
- Target (high)
- 88.00
- Strong buy0
- Buy4
- Hold3
- Sell0
- Strong sell1
Next earnings
Feb 25, 2027
Expected Feb 25, 2027. Consensus EPS estimate 0.00.
Financials — quick view
Earnings
| Report date | Quarter ending | EPS estimate | EPS reported | Surprise | Surprise % |
|---|---|---|---|---|---|
| Feb 25, 2027 | Dec 30, 2026 | 0.65 | — | — | — |
| Nov 9, 2026 | Sep 30, 2026 | 1.18 | 11.47 | +10.29 | +872.03% |
| Aug 10, 2026 | Jun 30, 2026 | 0.843 | 1.19 | +0.35 | +41.16% |
| May 4, 2026 | Mar 31, 2026 | 1.21 | 0.83 | -0.38 | -31.40% |
| Feb 26, 2026 | Dec 31, 2025 | 0.801 | 0.80 | 0.00 | -0.12% |
| Nov 6, 2025 | Sep 30, 2025 | 1.24 | 0.69 | -0.55 | -44.35% |
Upgrades / downgrades
| Date | Firm | Action | From | To |
|---|---|---|---|---|
| Nov 16, 2026 | Wells Fargo | main | Equal-Weight | Equal-Weight |
| Nov 13, 2026 | B of A Securities | down | Buy | Underperform |
| Oct 19, 2026 | Wells Fargo | main | Equal-Weight | Equal-Weight |
| Sep 2, 2026 | Truist Securities | main | Buy | Buy |
| Sep 1, 2026 | Wells Fargo | main | Equal-Weight | Equal-Weight |
| Jun 25, 2026 | Deutsche Bank | main | Hold | Hold |
About National Health Investors, Inc.
National Health Investors, Inc. is a self-managed real estate investment trust (REIT). The Company owns, leases, operates and finances the development of high-quality real estate properties in the United States, focusing on senior housing communities and medical facilities. The Company operates through two reportable segments, Real Estate Investments and SHOP. The Company's real estate property investments include independent living facilities, assisted living facilities, entrance fee communities, senior living campuses, skilled nursing facilities and hospitals. National Health Investors, Inc. was established on October 15th, 1991, and was incorporated in 1991 in Maryland and is based in Murfreesboro, Tennessee.
- Sector
- Real Estate
- Industry
- REIT - Healthcare Facilities
- Country
- United States
- Website
- nhireit.com
News
 National Health Investors: Short-Term SHOP Pessimism Is Creating Long-Term Value
 Wells Fargo Maintains Equal-Weight on National Health Investors, Lowers Price Target to $65
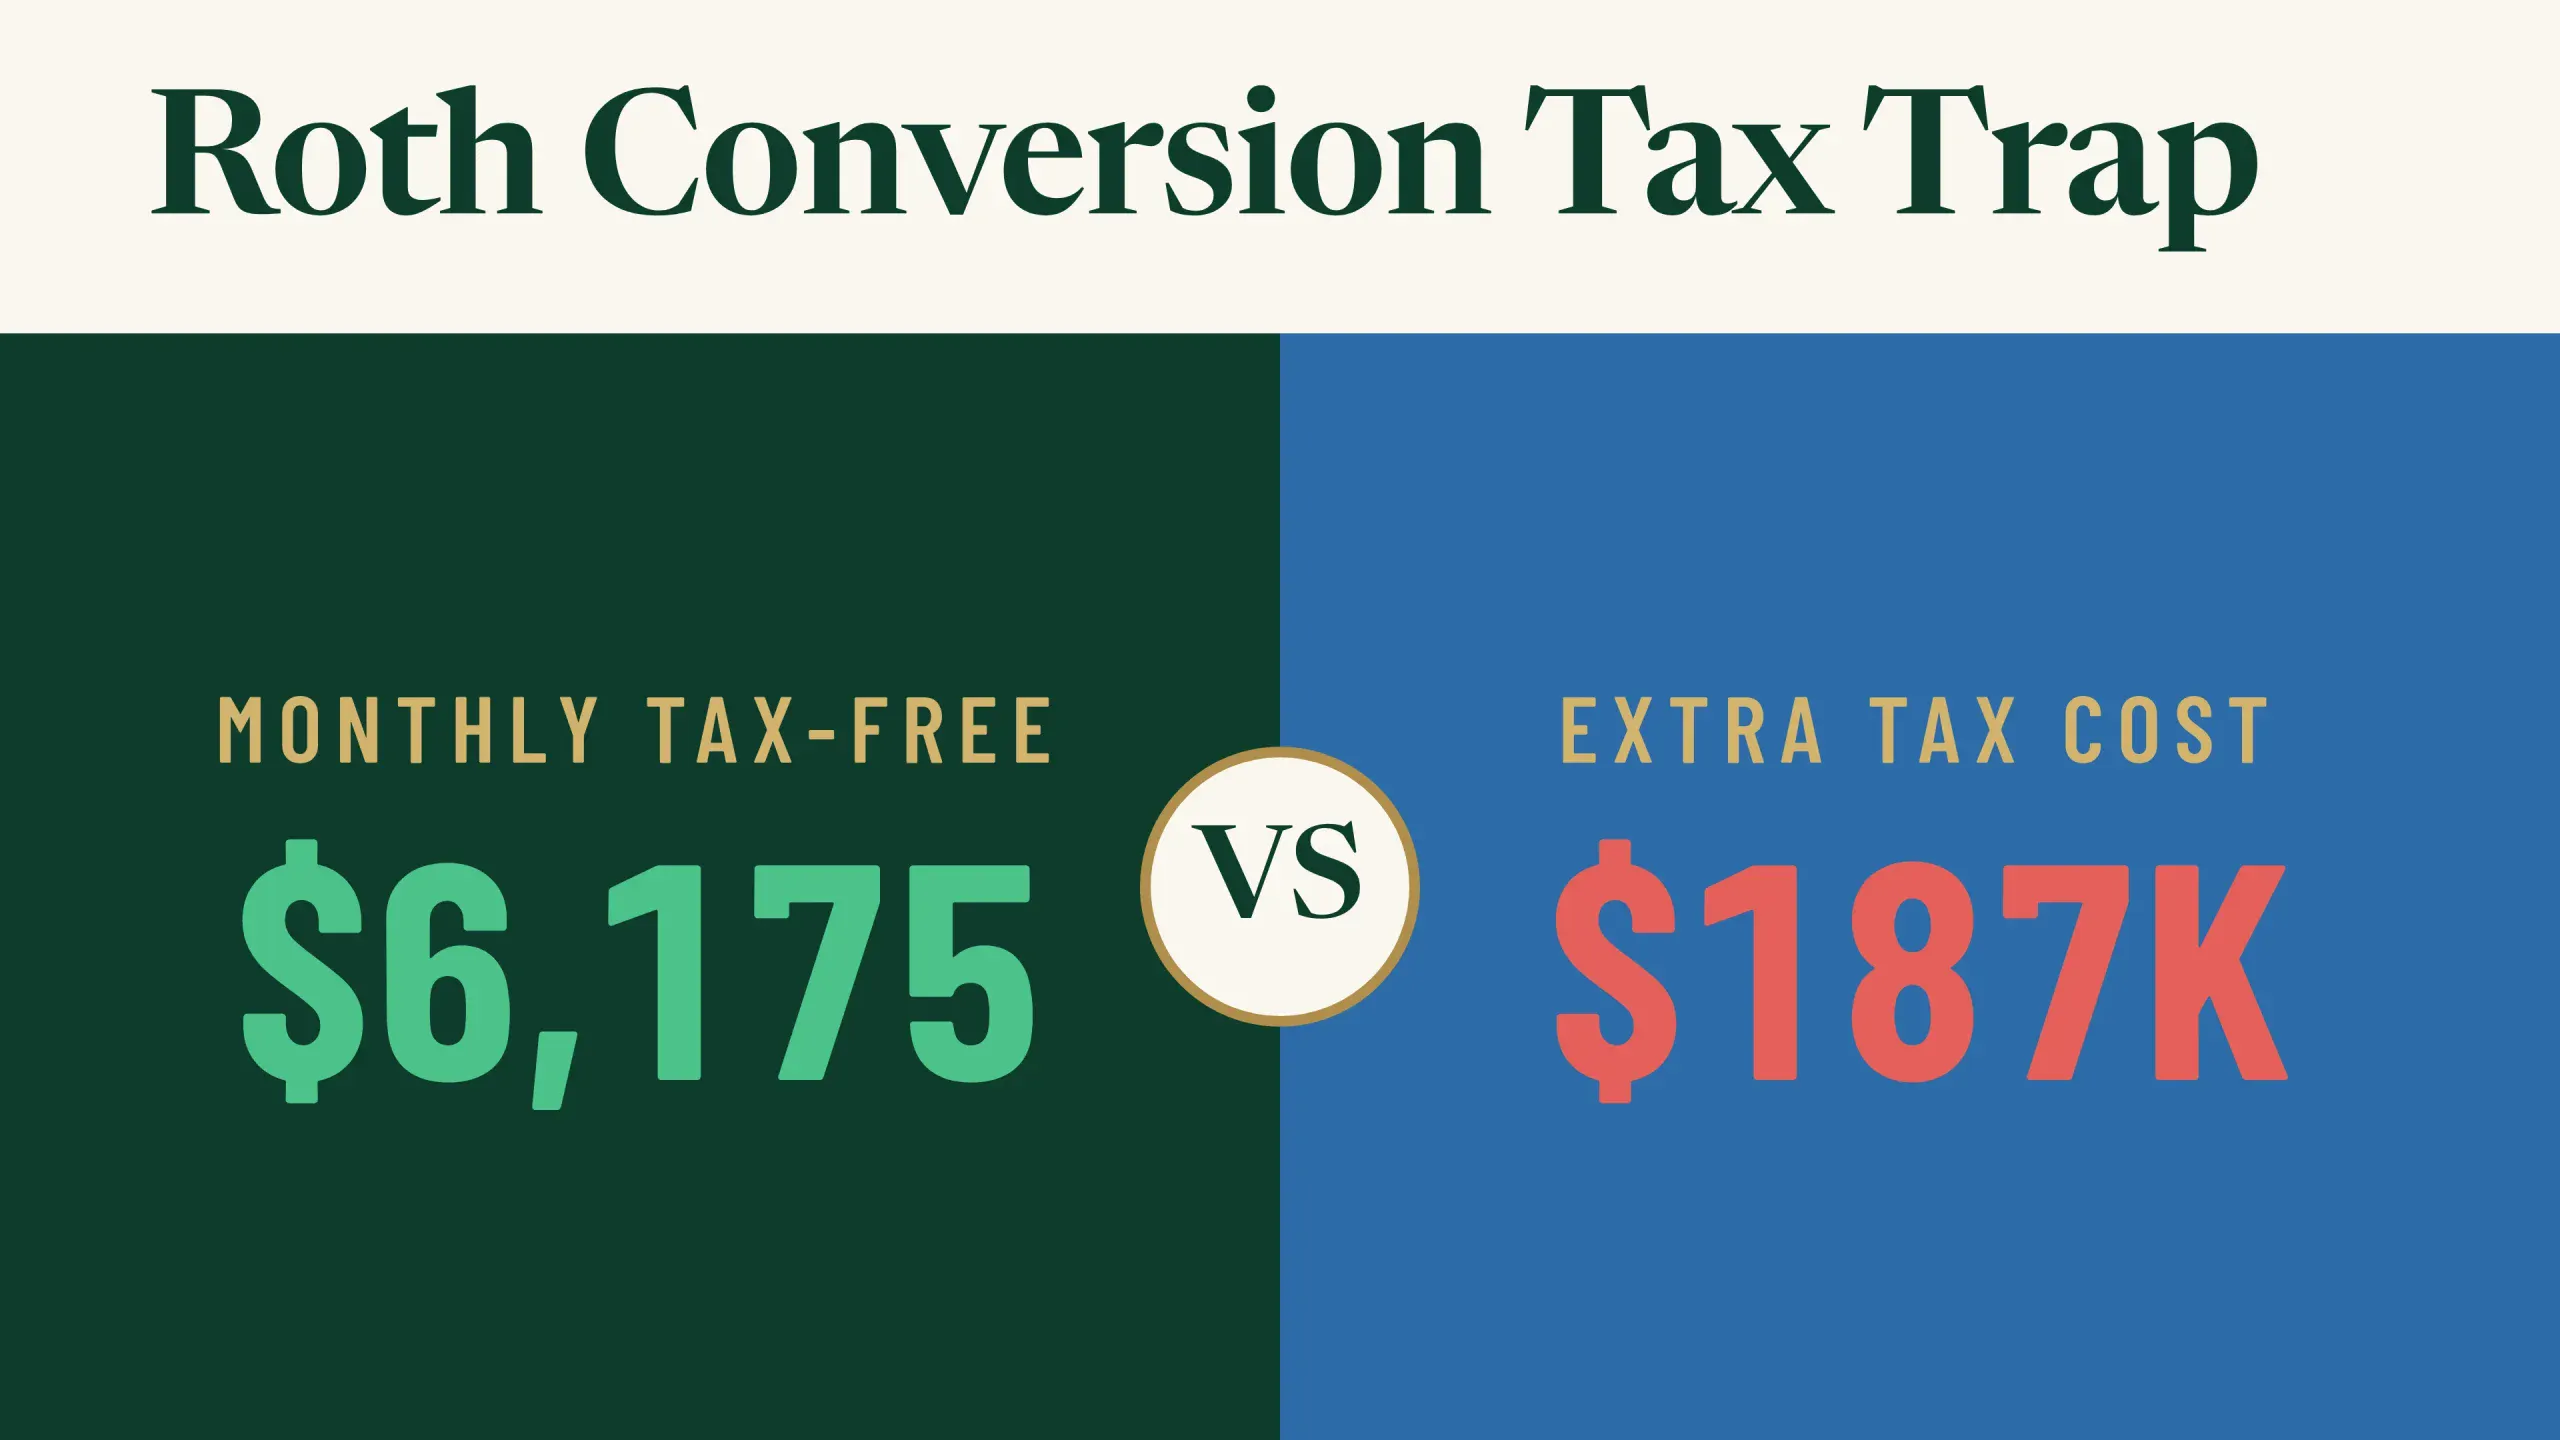 The Roth Conversion Mistake That Turns $6,175 a Month Tax-Free Into a Five-Figure Tax Bill
 B of A Securities Downgrades National Health Investors to Underperform, Lowers Price Target to $67
 RLJ vs. NHI: Which Stock Is the Better Value Option?
 National Health Investors Q3 2026 Earnings Call Transcript
- National Health Investors Lowers FY2026 FFO Guidance from $4.74-$4.79 to $4.68-$4.70 vs $4.76 Est
 National Health Investors Q3 FFO $1.12 Misses $1.14 Estimate, Sales $113.483M Beat $107.737M Estimate
- Wells Fargo Maintains Equal-Weight on National Health Investors, Lowers Price Target to $68
Your note
Sign in to keep a note on NHI — it syncs with the Stock Master app.
Insider holders
| Insider | Relation | Latest transaction | Date | Shares held |
|---|---|---|---|---|
| ADAMS ROBERT G. | Director | Conversion of Exercise of derivative security | Jan 26, 2026 | 0 |
| COLDEN TRACY M J | Director | Stock Award(Grant) | Mar 2, 2026 | 12,858 |
| GAINES KRISTIN SALLEE | Officer | Conversion of Exercise of derivative security | Jan 29, 2026 | 73,763 |
| JOBE JAMES R | Director | Stock Gift | Jun 4, 2026 | 35,040 |
| MCCABE ROBERT A. JR. | Director | Purchase | Jun 14, 2026 | 44,159 |
| MENDELSOHN D ERIC | Chief Executive Officer | Purchase | Jun 4, 2026 | 133,316 |
Institution ownership
| Holder | % held | Shares | Value | Reported |
|---|---|---|---|---|
| Blackrock Inc. | 17.79% | 8,735,588 | 537.68M | Sep 29, 2026 |
| Vanguard Portfolio Management LLC | 9.74% | 4,784,354 | 294.48M | Sep 29, 2026 |
| State Street Corporation | 5.69% | 2,796,646 | 172.13M | Sep 29, 2026 |
| Vanguard Capital Management LLC | 4.51% | 2,216,311 | 136.41M | Sep 29, 2026 |
| Principal Financial Group, Inc. | 4.07% | 1,997,739 | 122.96M | Sep 29, 2026 |
| Bank Of New York Mellon Corporation | 3.99% | 1,957,147 | 120.46M | Sep 29, 2026 |
Fund ownership
| Holder | % held | Shares | Value | Reported |
|---|---|---|---|---|
| iShares Trust-iShares Core S&P Small-Cap ETF | 5.95% | 2,924,346 | 179.99M | Sep 29, 2026 |
| VANGUARD SPECIALIZED FUNDS-Vanguard Real Estate Index Fund | 3.57% | 1,750,854 | 107.77M | Jul 30, 2026 |
| VANGUARD INDEX FUNDS-Vanguard Total Stock Market Index Fund | 2.97% | 1,459,676 | 89.84M | Jun 29, 2026 |
| iShares Trust-iShares Russell 2000 ETF | 2.58% | 1,268,277 | 78.06M | Sep 29, 2026 |
| VANGUARD INDEX FUNDS-Vanguard Small-Cap Index Fund | 2.15% | 1,057,147 | 65.07M | Jun 29, 2026 |
| Principal Funds, Inc-Real Estate Securities Fund | 1.71% | 840,085 | 51.71M | Jul 30, 2026 |