

Cheniere Energy, Inc. LNG
At closeNov 11, 2026, 5:28 AM EST
Pre-market · Nov 11, 5:28 AM ET
- YTD
- +50.98%
- 1 year
- +38.44%
- Market cap
- 59.93B
- Revenue (ttm)
- 22.67B
- Profit margin
- 13.40%
- EPS (ttm)
- 14.05
- Shares out
- 204.20M
- P/E ratio
- 20.89
- Forward P/E
- 14.17
- Dividend
- 2.50 (0.88%)
- Ex-dividend date
- Nov 8, 2026
- YTD return
- +50.98%
- 1-year return
- +38.44%
- Volume
- 2.02M
- Avg volume
- 2.02M
- Open
- 281.46
- Previous close
- 284.95
- Day's range
- 280.50 – 293.58
- 52-week range
- 186.20 – 330.73
- Beta
- 0.00
- Analysts
- Strong Buy
- Price target
- 335.70 (+14.4%)
- Earnings date
- Feb 25, 2027
5D -8.49 (-2.81%)
Key statistics
- Enterprise value
- 89.61B
- PEG ratio
- 9.46
- Price / sales
- 2.64
- Price / book
- 9.18
- Dividend yield
- 0.88%
- Payout ratio
- 15.80%
- Revenue growth
- 39.90%
- Free cash flow
- 1.80B
- Total cash
- 1.68B
- Total debt
- 27.69B
- Return on equity
- 39.68%
- Short % of float
- 2.29%
- 50-day average
- 283.58
- 200-day average
- 259.10
Analyst view
Consensus: strong buy
- Target (low)
- 275.00
- Target (mean)
- 335.70
- Target (high)
- 377.00
- Strong buy5
- Buy14
- Hold3
- Sell0
- Strong sell0
Next earnings
Feb 25, 2027
Expected Feb 25, 2027. Consensus EPS estimate 8.49.
Financials — quick view
Earnings
| Report date | Quarter ending | EPS estimate | EPS reported | Surprise | Surprise % |
|---|---|---|---|---|---|
| Feb 25, 2027 | Dec 30, 2026 | 6.41 | — | — | — |
| Oct 29, 2026 | Sep 30, 2026 | 4.33 | 5.65 | +1.32 | +30.48% |
| Aug 6, 2026 | Jun 30, 2026 | 3.11 | 14.65 | +11.54 | +371.06% |
| May 7, 2026 | Mar 31, 2026 | 4.25 | -16.65 | -20.90 | -491.76% |
| Feb 26, 2026 | Dec 31, 2025 | 3.80 | 10.71 | +6.91 | +181.84% |
| Oct 30, 2025 | Sep 30, 2025 | 2.91 | 4.75 | +1.84 | +63.23% |
Upgrades / downgrades
| Date | Firm | Action | From | To |
|---|---|---|---|---|
| Nov 3, 2026 | Scotiabank | main | Sector Outperform | Sector Outperform |
| Nov 3, 2026 | TD Cowen | main | Buy | Buy |
| Oct 30, 2026 | Morgan Stanley | main | Overweight | Overweight |
| Oct 30, 2026 | Wells Fargo | main | Overweight | Overweight |
| Oct 30, 2026 | Barclays | main | Overweight | Overweight |
| Oct 30, 2026 | Bernstein | main | Outperform | Outperform |
About Cheniere Energy, Inc.
Cheniere Energy, Inc., an energy infrastructure company, primarily engages in the liquefied natural gas (LNG) related businesses in the United States. The company owns and operates the Sabine Pass LNG terminal in Cameron Parish, Louisiana; and the Corpus Christi LNG terminal near Corpus Christi, Texas. It also owns and operates the Creole Trail pipeline, a 94-mile natural gas supply pipeline that interconnects the Sabine Pass LNG Terminal with several large interstate and intrastate pipelines; and the Corpus Christi pipeline, a 21-mile natural gas supply pipeline that interconnects the Corpus Christi LNG terminal with interstate and intrastate natural gas pipelines. In addition, the company engages in the LNG and natural gas marketing business. Cheniere Energy, Inc. was incorporated in 1983 and is headquartered in Houston, Texas.
- Sector
- Energy
- Industry
- Oil & Gas Midstream
- Country
- United States
- Website
- cheniere.com
News
 Datacentrex Reports Third Quarter 2026 Results and $30 Million Investment in Eagle LNG
 4 Energy Stocks to Watch as QatarEnergy Eyes More U.S. LNG Deals
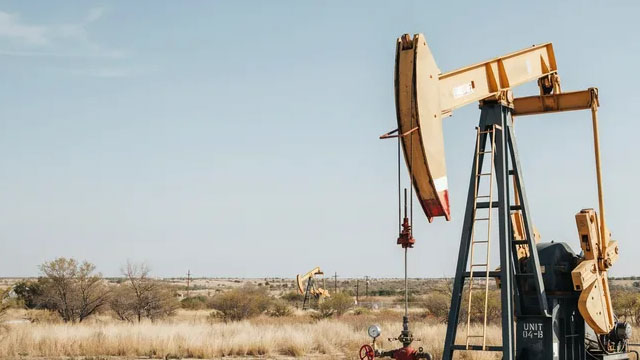 LNG Giant Venture Global Looks to Become a Vertically Integrated AI Utility
 3 Dividend Stocks Just Gave Investors a Raise. Two Hiked Payouts More Than 12%
 W&T Offshore (NYSE:WTI) & Cheniere Energy (NYSE:LNG) Head-To-Head Survey
 Emerson Electric: LNG And Reshoring Tailwinds Justify Buying Despite A Rich Multiple
 Excelerate Energy and AxDo Bahamas Announce Long-Term LNG Supply Agreement Supporting Planned Bahamas LNG Hub
 4,102 Cheniere Energy, Inc. $LNG Shares Bought by Chicago Partners Investment Group LLC
 Best Momentum Stocks to Buy for November 4th
 New Strong Buy Stocks for November 4th
Your note
Sign in to keep a note on LNG — it syncs with the Stock Master app.
Insider holders
| Insider | Relation | Latest transaction | Date | Shares held |
|---|---|---|---|---|
| BOTTA GIAN ANDREA | Director | Sale | Mar 26, 2026 | 30,186 |
| COLLAWN PATRICIA K | Director | Stock Award(Grant) | May 13, 2026 | 11,873 |
| DAVIS ZACHARY A | Chief Financial Officer | Sale | Mar 29, 2026 | 87,146 |
| FEYGIN ANATOL | Officer | Sale | Mar 25, 2026 | 147,108 |
| FUSCO JACK A. | Chief Executive Officer | Conversion of Exercise of derivative security | Feb 10, 2026 | 724,062 |
| HINZ MAAS | Officer | Conversion of Exercise of derivative security | Feb 10, 2026 | 19,845 |
Institution ownership
| Holder | % held | Shares | Value | Reported |
|---|---|---|---|---|
| Blackrock Inc. | 8.67% | 17,712,080 | 5.20B | Jun 29, 2026 |
| Vanguard Portfolio Management LLC | 4.70% | 9,603,722 | 2.82B | Jun 29, 2026 |
| Vanguard Capital Management LLC | 4.64% | 9,476,116 | 2.78B | Jun 29, 2026 |
| State Street Corporation | 2.91% | 5,938,476 | 1.74B | Jun 29, 2026 |
| FMR, LLC | 2.42% | 4,938,766 | 1.45B | Jun 29, 2026 |
| Morgan Stanley | 2.24% | 4,573,650 | 1.34B | Jun 29, 2026 |
Fund ownership
| Holder | % held | Shares | Value | Reported |
|---|---|---|---|---|
| VANGUARD INDEX FUNDS-Vanguard Total Stock Market Index Fund | 3.26% | 6,652,921 | 1.95B | Jun 29, 2026 |
| VANGUARD INDEX FUNDS-Vanguard Mid-Cap Index Fund | 2.22% | 4,540,634 | 1.33B | Jun 29, 2026 |
| Fidelity Contrafund | 1.48% | 3,016,024 | 885.20M | Sep 29, 2026 |
| VANGUARD INDEX FUNDS-Vanguard Extended Market Index Fund | 1.18% | 2,402,304 | 705.08M | Jun 29, 2026 |
| VANGUARD INDEX FUNDS-Vanguard Value Index Fund | 0.98% | 1,998,028 | 586.42M | Jun 29, 2026 |
| Tortoise Capital Series TRT-Tortoise Energy Infrastructure Total Retur | 0.71% | 1,443,945 | 423.80M | Sep 29, 2026 |