

JBS N.V. JBS
Regular-session close
Pre-market · Nov 20, 4:45 AM ET
- YTD
- -17.75%
- 1 year
- -13.18%
5D -0.50 (-4.05%)
- Market cap
- 12.70B
- Revenue (ttm)
- 91.31B
- Profit margin
- 0.76%
- EPS (ttm)
- 0.70
- Shares out
- 776.41M
- P/E ratio
- 16.94
- Forward P/E
- 8.22
- Dividend
- 1.00 (8.26%)
- Ex-dividend date
- May 18, 2026
- YTD return
- -17.75%
- 1-year return
- -13.18%
- Volume
- 14.08M
- Avg volume
- 6.55M
- Open
- 11.74
- Previous close
- 12.02
- Day's range
- 11.50 – 11.93
- 52-week range
- 10.61 – 18.65
- Analysts
- Buy
- Price target
- 16.69 (+40.7%)
- Earnings date
- Mar 24, 2027
- 50-day average
- 12.26
- 200-day average
- 13.90
Key statistics
- Enterprise value
- 36.24B
- Price / sales
- 0.43
- Price / book
- 1.53
- Payout ratio
- 142.86%
- Revenue growth
- 0.60%
- Free cash flow
- 583.83M
- Total cash
- 4.15B
- Total debt
- 26.66B
- Return on equity
- 8.23%
- Short % of float
- 18.63%
Fundamental scorecard
12 of 25 checks passed on JBS’s reported financials
12of 25 checks passed
- Value 2 of 5
- Growth 4 of 5
- Profitability 2 of 5
- Financial health 1 of 5
- Dividend 3 of 5
Statements to Sep 30, 2026.
Analyst view
Consensus: buy
- Target (low)
- 13.08
- Target (mean)
- 16.69
- Target (high)
- 19.47
- Strong buy5
- Buy8
- Hold2
- Sell0
- Strong sell0
Next earnings
Mar 24, 2027
Expected Mar 24, 2027. Consensus EPS estimate 1.02.
Financials — quick view
Earnings
| Report date | Quarter ending | EPS estimate | EPS reported | Surprise | Surprise % |
|---|---|---|---|---|---|
| Mar 24, 2027 | Mar 30, 2027 | 0.47 | — | — | — |
| Nov 9, 2026 | Sep 30, 2026 | 0.2148 | 0.16 | -0.05 | -25.51% |
| Aug 10, 2026 | Jun 30, 2026 | 0.3125 | 0.20 | -0.11 | -36.00% |
| May 12, 2026 | Mar 31, 2026 | 0.2044 | 0.20 | 0.00 | -2.15% |
| Feb 11, 2026 | Dec 31, 2025 | 2.26 | 0.39 | -1.87 | -82.74% |
| Nov 13, 2025 | Sep 30, 2025 | 0.507 | 0.52 | +0.01 | +2.56% |
Upgrades / downgrades
| Date | Firm | Action | From | To |
|---|---|---|---|---|
| Oct 22, 2026 | JP Morgan | main | Overweight | Overweight |
| Oct 9, 2026 | JP Morgan | main | Overweight | Overweight |
| Aug 24, 2026 | UBS | main | Buy | Buy |
| Aug 17, 2026 | Stephens & Co. | main | Overweight | Overweight |
| Aug 12, 2026 | JP Morgan | main | Overweight | Overweight |
| Jul 28, 2026 | JP Morgan | up | Neutral | Overweight |
About JBS N.V.
JBS N.V., together with its subsidiaries, engages in the processing of animal proteins, encompassing activities related to beef, pork, lamb, and poultry worldwide. The company is involved in the production and marketing of prepared foods and other related products, as well as operations in leather, collagen, hygiene and beauty products, metal packaging, biodiesel, and other related businesses. It offers its products under the Seara, Doriana, Pilgrim's, Moy Park, Primo, Friboi, Maturatta, Swift, Ozo, Adaptable Meals, and other brand names. The company was founded in 1953 and is based in Amstelveen, the Netherlands.
- Sector
- Consumer Defensive
- Industry
- Packaged Foods
- Country
- Netherlands
- Website
- jbsglobal.com
News
 JBS Completes Transaction for Multiprotein Hub in the Middle East
 Reported Earlier, President Trump Says On Social Media That Congress Needs To Pass A Farm Bill In The Remaining Days Of The Current Session
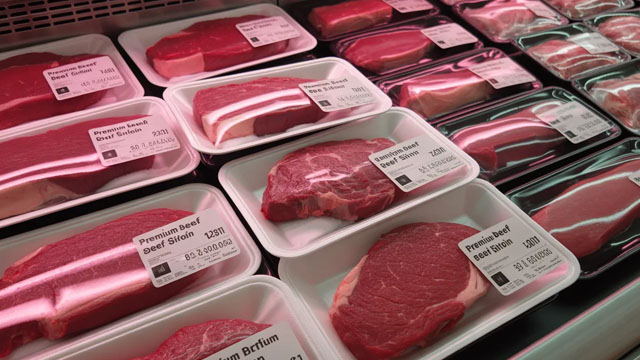 JBS Q3: Weak Short-Term Results Don't Erase The Long-Term Thesis
 Nasdaq 100 Turns Green Despite Nvidia's 5% Drop on Huang Exit: Stock Market Today
 JBS Q3 2026 Earnings Call Transcript
 Groupon Posts Downbeat Q3 Results, Joins GeneDx Holdings, Qualys And Other Big Stocks Moving Lower In Tuesday’s Pre-Market Session
 CORRECTION: JBS Q3 Adj. EPS $0.16 Misses $0.25 Estimate, Sales $22.738B Beat $22.629B Estimate
 JBS Q3 Adj. EPS $0.16 Misses $0.25 Estimate, Sales $22.738M Miss $22.629B Estimate
- JBS Acquires Consumer Products Firm Flora For $542M
 KKR, Constellation Energy On Deck Monday As Private Credit, Power Face Test
Your note
Sign in to keep a note on JBS — it syncs with the Stock Master app.
Insider holders
| Insider | Relation | Latest transaction | Date | Shares held |
|---|---|---|---|---|
| CAVALCANTI GUILHERME PERBOYRE | Officer | Sale | Aug 23, 2026 | 0 |
Institution ownership
| Holder | % held | Shares | Value | Reported |
|---|---|---|---|---|
| Bndes Participacoes S.A. | 25.65% | 199,288,206 | 2.36B | Sep 29, 2026 |
| Davis Selected Advisers | 6.72% | 52,234,136 | 619.76M | Sep 29, 2026 |
| Blackrock Inc. | 4.11% | 31,913,415 | 378.65M | Sep 29, 2026 |
| Brandes Investment Partners L.P. | 3.61% | 28,083,063 | 333.21M | Sep 29, 2026 |
| Shaw D.E. & Co., Inc. | 1.31% | 10,157,288 | 120.52M | Sep 29, 2026 |
| UBS Group AG | 1.25% | 9,721,370 | 115.34M | Sep 29, 2026 |
Fund ownership
| Holder | % held | Shares | Value | Reported |
|---|---|---|---|---|
| DAVIS NEW YORK VENTURE FUND INC-Davis New York Venture Fund | 2.48% | 19,233,729 | 228.21M | Jul 30, 2026 |
| iShares, Inc.-iShares MSCI Brazil ETF | 0.87% | 6,781,592 | 80.46M | Sep 29, 2026 |
| SELECTED AMERICAN SHARES INC-SELECTED AMERICAN SHARES | 0.66% | 5,093,430 | 60.43M | Jun 29, 2026 |
| Carillon Series Trust-Carillon Scout Mid Cap Fund | 0.53% | 4,100,393 | 48.65M | Sep 29, 2026 |
| iShares, Inc.-iShares Core MSCI Emerging Markets ETF | 0.48% | 3,713,564 | 44.06M | Sep 29, 2026 |
| Columbia Funds Series Trust-Columbia Overseas Value Fund | 0.42% | 3,291,530 | 39.05M | Aug 30, 2026 |