

Friedman Industries, Incorporated FRD
At closeNov 4, 2026, 4:48 PM EST
After hours · Nov 4, 4:48 PM ET
- YTD
- +89.31%
- 1 year
- +84.45%
- Market cap
- 279.78M
- Revenue (ttm)
- 469.52M
- Profit margin
- 1.71%
- EPS (ttm)
- 3.62
- Shares out
- 6.97M
- P/E ratio
- 10.72
- Dividend
- 0.16 (0.97%)
- Ex-dividend date
- Jan 16, 2025
- YTD return
- +89.31%
- 1-year return
- +84.45%
- Volume
- 78.40K
- Avg volume
- 62.86K
- Open
- 42.16
- Previous close
- 41.05
- Day's range
- 38.63 – 42.61
- 52-week range
- 17.01 – 48.08
2Y +24.65 (+174.33%)
Key statistics
- Enterprise value
- 0
- PEG ratio
- 0.00
- Price / sales
- 0.24
- Price / book
- 0.86
- Dividend yield
- 0.97%
- Payout ratio
- 10.53%
- Revenue growth
- 180.20%
- Free cash flow
- 21.17M
- Total cash
- 0
- Total debt
- 0
- Return on equity
- 6.29%
- Short % of float
- 0.06%
- 50-day average
- 15.09
- 200-day average
- 16.39
Next earnings
Consensus EPS estimate 0.00.
Financials — quick view
Earnings
| Report date | Quarter ending | EPS estimate | EPS reported | Surprise | Surprise % |
|---|---|---|---|---|---|
| Nov 12, 2024 | Sep 1, 2024 | 0.00 | -0.10 | — | — |
| Aug 8, 2024 | Jun 1, 2024 | 0.00 | 0.37 | — | — |
| Jun 11, 2024 | Mar 1, 2024 | 0.00 | 0.71 | — | — |
| Feb 14, 2024 | Dec 1, 2023 | 0.00 | 0.16 | — | — |
| Nov 14, 2023 | Sep 1, 2023 | 0.00 | 0.48 | — | — |
| Jun 29, 2023 | Mar 1, 2023 | 0.00 | 0.86 | — | — |
About Friedman Industries, Incorporated
Friedman Industries, Incorporated engages in the manufacture and processing of steel products in the United States. It operates in two segments, Flat-Roll Products and Tubular Products. The Flat-Roll Product segment is involved in the conversion of steel coils into flat sheet and plate steel cut to customer specifications and reselling steel coils, as well as provision of process and storage services for customer-owned coils on a fee basis. The segment offers its products and services to steel distributors and customers manufacturing steel products, such as steel buildings, railroad cars, barges, tanks and containers, trailers, component parts, and other fabricated steel products. The Tubular Product segment manufactures line and oil country pipes, as well as pipes for structural applications. This segment sells its tubular products principally to steel and pipe distributors through its own sales force. The company was incorporated in 1965 and is based in Longview, Texas.
- Sector
- Basic Materials
- Industry
- Steel
- Country
- United States
- Website
- friedmanindustries.com
News
 Friedman Surges More Than 127% in 6 Months: What's Driving the Stock?
 Head-To-Head Contrast: Friedman Industries (NASDAQ:FRD) versus Voestalpine (OTCMKTS:VLPNY)
 Revisiting 2 Outperform Microcaps
 Friedman Industries, Incorporated Announces Cash Dividend
 Friedman Stock Surges Nearly 84% in 3 Months: Can the Momentum Last?
 Friedman Industries Q1 EPS $1.79 Up From $0.71 YoY, Sales $239.971M Up From $134.777M YoY
 Friedman Industries, Incorporated Announces First Quarter Results
 Friedman Industries (NASDAQ:FRD) Trading Down 1.3% – Time to Sell?
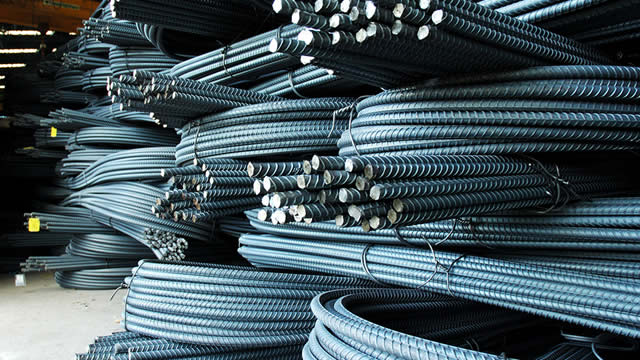 Friedman Stock Gains 89% in 3 Months: What's Driving the Rally?
 Friedman Industries, Incorporated Announces Cash Dividend
Your note
Sign in to keep a note on FRD — it syncs with the Stock Master app.
Insider holders
| Insider | Relation | Latest transaction | Date | Shares held |
|---|---|---|---|---|
| AGRAWAL DURGA D | Director | Stock Award(Grant) | Jan 8, 2024 | 26,504 |
| LARUE ALEX | Chief Executive Officer | Sale | Aug 16, 2023 | 22,907 |
| REICHENTHAL MAX ALAN | Director | Purchase | Nov 19, 2024 | 32,761 |
| SCOTT SANDRA KAY | Director | Stock Award(Grant) | Jan 8, 2024 | 6,741 |
| SPIRA JOEL | Director | Purchase | Jun 24, 2024 | 16,504 |
| STEVENSON TIM SCOTT | Director | Stock Award(Grant) | Jan 8, 2024 | 26,504 |
Institution ownership
| Holder | % held | Shares | Value | Reported |
|---|---|---|---|---|
| Dimensional Fund Advisors LP | 8.04% | 559,845 | 8.92M | Sep 29, 2024 |
| Gendell, Jeffrey L. | 6.50% | 453,129 | 7.22M | Sep 29, 2024 |
| De Lisle Partners LLP | 6.03% | 419,816 | 6.69M | Sep 29, 2024 |
| Renaissance Technologies, LLC | 5.16% | 359,182 | 5.72M | Sep 29, 2024 |
| Vanguard Group Inc | 4.44% | 309,421 | 4.93M | Sep 29, 2024 |
| Bridgeway Capital Management, Inc. | 2.26% | 157,199 | 2.50M | Sep 29, 2024 |
Fund ownership
| Holder | % held | Shares | Value | Reported |
|---|---|---|---|---|
| Vanguard Total Stock Market Index Fund | 2.97% | 206,582 | 3.29M | Sep 29, 2024 |
| DFA U.S. Small Cap Value Series | 2.50% | 174,114 | 2.77M | Jul 30, 2024 |
| Vanguard Extended Market Index Fund | 1.34% | 93,681 | 1.49M | Sep 29, 2024 |
| DFA U.S. Micro Cap Series | 1.06% | 73,974 | 1.18M | Jul 30, 2024 |
| DFA U.S. Targeted Value Portfolio | 1.05% | 73,312 | 1.17M | Jul 30, 2024 |
| Bridgeway Funds Inc-Ultra Small Company Fund | 1.05% | 73,121 | 1.16M | Sep 29, 2024 |