

Invesco S&P Emerging Markets Momentum ETF EEMO
14.78 USD -1.53 (-9.37%)
Regular-session close
14.78 0.00 0.00%
After hours · Nov 20, 4:15 PM ET
14.78 Day range 15.70
14.78 52-week range 25.75
- YTD
- -15.80%
- 1 year
- -14.53%
No chart data for this range yet.
- YTD return
- -15.80%
- 1-year return
- -14.53%
- 50-day average
- 16.77
- 200-day average
- 16.73
- Volume
- 22.91K
- Avg volume
- 118.22K
- Open
- 15.56
- Previous close
- 16.31
- Day's range
- 14.78 – 15.70
- 52-week range
- 14.78 – 25.75
About Invesco S&P Emerging Markets Momentum ETF
The fund will invest at least 90% of its total assets in securities that comprise the underlying index, as well as ADRs and GDRs that represent securities in the underlying index. Strictly in accordance with its guidelines and mandated procedures, the index provider compiles, maintains and calculates the underlying index, which is composed of constituents of the S&P Emerging Plus LargeMidCap that have the highest "momentum score."
News
 Invesco S&P Emerging Markets Momentum ETF (NYSEARCA:EEMO) Short Interest Up 85.4% in February
 Are Emerging Market ETFs in Trouble?
 Investing In Emerging Markets As Global Rates Rise
 5 Emerging Market ETFs That Gained Big on Biden Inauguration
 Can a Weaker Dollar Provide Momentum For This Emerging Markets ETF?
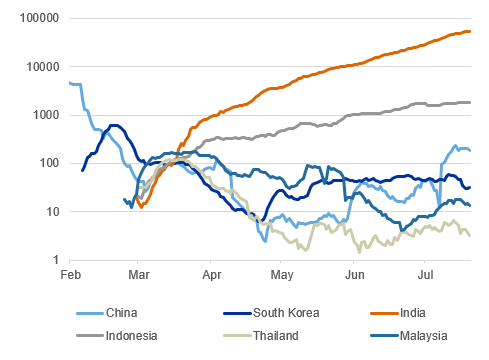 3 Big Challenges For Emerging Markets Amid COVID-19
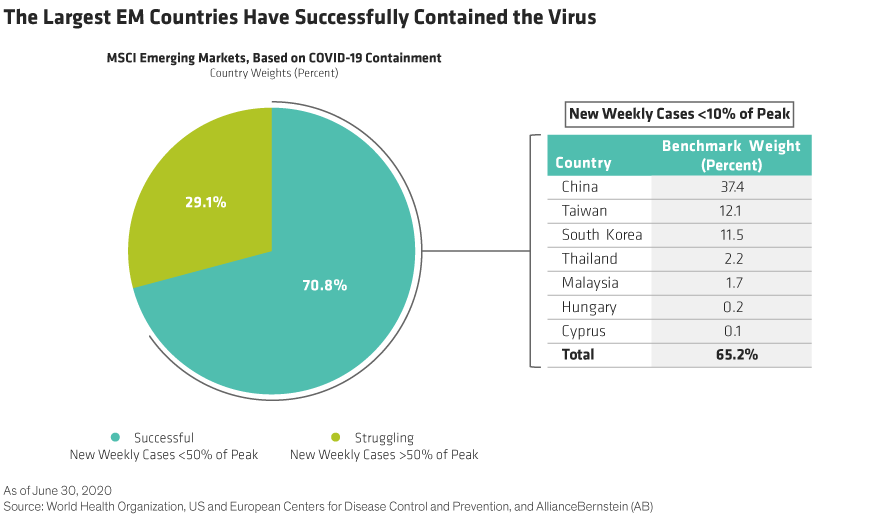 Emerging-Market Equities: Looking Past The Pandemic
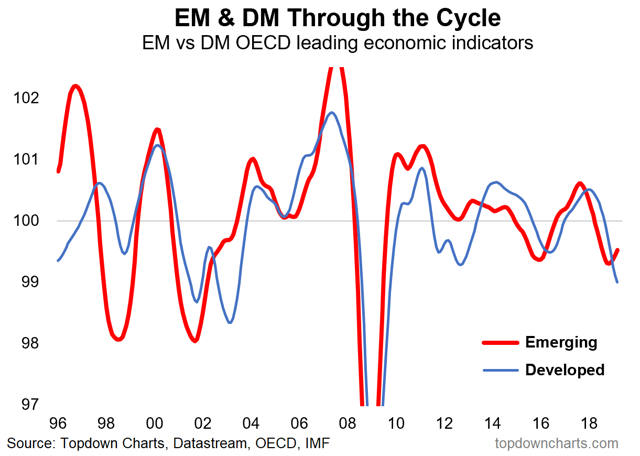 Top 5 Charts: EM, China, Gold, And Global Monetary Policy
 Exploring The Opportunity In EMD
Your note
Sign in to keep a note on EEMO — it syncs with the Stock Master app.