

Caesars Entertainment, Inc. CZR
Nov 4, 2026, 1:03 PM EST
- YTD
- +25.14%
- 1 year
- +46.20%
- Market cap
- 5.97B
- Revenue (ttm)
- 11.72B
- Profit margin
- -4.55%
- EPS (ttm)
- -2.61
- Shares out
- 203.81M
- Forward P/E
- 123.14
- YTD return
- +25.14%
- 1-year return
- +46.20%
- Volume
- 2.74M
- Avg volume
- 5.07M
- Open
- 29.09
- Previous close
- 29.06
- Day's range
- 29.02 – 29.30
- 52-week range
- 17.86 – 30.88
- Beta
- 1.89
- Analysts
- Hold
- Price target
- 31.27 (+6.8%)
- Earnings date
- Feb 16, 2027
5D +0.56 (+1.95%)
Key statistics
- Enterprise value
- 31.02B
- PEG ratio
- 4.51
- Price / sales
- 0.51
- Price / book
- 1.81
- Dividend yield
- 0.00%
- Payout ratio
- 0.00%
- Revenue growth
- 2.50%
- Free cash flow
- 783.63M
- Total cash
- 864.00M
- Total debt
- 25.81B
- Return on equity
- -12.56%
- Short % of float
- 11.81%
- 50-day average
- 29.45
- 200-day average
- 27.67
Analyst view
Consensus: hold
- Target (low)
- 31.00
- Target (mean)
- 31.27
- Target (high)
- 35.00
- Strong buy1
- Buy0
- Hold14
- Sell0
- Strong sell0
Next earnings
Feb 16, 2027
Expected Feb 16, 2027. Consensus EPS estimate -0.19.
Financials — quick view
Earnings
| Report date | Quarter ending | EPS estimate | EPS reported | Surprise | Surprise % |
|---|---|---|---|---|---|
| Feb 16, 2027 | Dec 30, 2026 | -0.15 | — | — | — |
| Oct 27, 2026 | Sep 30, 2026 | -0.12308 | -0.61 | -0.49 | -395.61% |
| Jul 28, 2026 | Jun 30, 2026 | 0.04511 | -0.30 | -0.35 | -765.04% |
| Apr 28, 2026 | Mar 31, 2026 | -0.19 | -0.48 | -0.29 | -152.63% |
| Feb 17, 2026 | Dec 31, 2025 | -0.18 | -1.23 | -1.05 | -583.33% |
| Oct 28, 2025 | Sep 30, 2025 | -0.11 | -0.27 | -0.16 | -145.45% |
Upgrades / downgrades
| Date | Firm | Action | From | To |
|---|---|---|---|---|
| Jul 29, 2026 | TD Cowen | down | Buy | Hold |
| Jul 29, 2026 | Macquarie | main | Neutral | Neutral |
| Jul 9, 2026 | Barclays | down | Overweight | Equal-Weight |
| Jun 15, 2026 | Stifel | down | Buy | Hold |
| Jun 2, 2026 | Wells Fargo | main | Equal-Weight | Equal-Weight |
| Jun 1, 2026 | Macquarie | down | Outperform | Neutral |
About Caesars Entertainment, Inc.
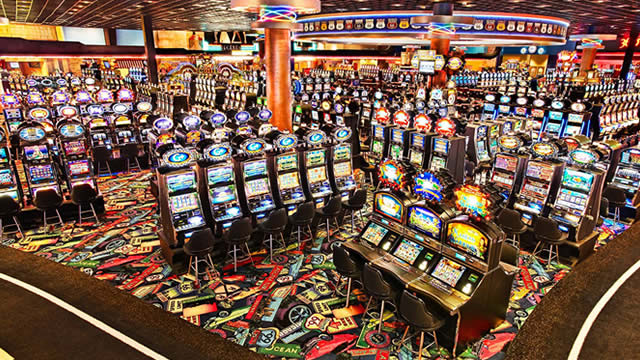
Caesars Entertainment, Inc. operates as a gaming and hospitality company. It owns, leases, brands, or manages domestic properties in 18 states with slot machines, video lottery terminals and e-tables, and hotel rooms, as well as table games, including poker. The company also operates and conducts online gaming, retail and online sports wagering across 42 jurisdictions in North America, and iGaming in five jurisdictions in North America; sports betting from retail and online sportsbooks; and other games, such as keno. In addition, it operates casinos, dining venues, bars, nightclubs, lounges, hotels, and entertainment venues; and provides staffing and management services. In addition, the company operates as a real estate leasing company, that constructs and develops the Grand Bazaar. The company was founded in 1937 and is based in Reno, Nevada.
- Sector
- Consumer Cyclical
- Industry
- Resorts & Casinos
- Country
- United States
- Website
- caesars.com
News
 VICI Properties Has Been Rehearsing For Caesars, One Lease At A Time
 Why Isn't VICI Properties Stock Bouncing Back After Strong Earnings?
 Caesars Entertainment (CZR) Q3 Earnings: How Key Metrics Compare to Wall Street Estimates
 Caesars Entertainment (CZR) Reports Q3 Loss, Lags Revenue Estimates
 Caesars Entertainment Q3 EPS $(0.61) Misses $(0.04) Estimate, Sales $2.940B Miss $2.968B Estimate
 Caesars Entertainment, Inc. Reports Third Quarter 2026 Results
 CZR Investors Have Opportunity to Join Caesars Entertainment, Inc. Fraud Investigation with SBS Law
 CZR Investors Have Opportunity to Join Caesars Entertainment, Inc. Fraud Investigation with SBS Law
 Cyndi Lauper Announces 2027 Dates at The Colosseum at Caesars Palace
 Caesars Entertainment, Inc. (NASDAQ:CZR) Stock Has Average Target Price of $30.71
Your note
Sign in to keep a note on CZR — it syncs with the Stock Master app.
Insider holders
| Insider | Relation | Latest transaction | Date | Shares held |
|---|---|---|---|---|
| BIUMI BONNIE SUSAN | Director | Stock Award(Grant) | Jan 22, 2026 | 43,149 |
| CARANO ANTHONY L | President | Stock Award(Grant) | Feb 16, 2026 | 309,861 |
| CARANO GARY L. | Officer and Director | Stock Award(Grant) | Feb 16, 2026 | 8,945,860 |
| FAHRENKOPF FRANK J JR | Director | Stock Award(Grant) | Jan 22, 2026 | 18,271 |
| JONES JOSH | Officer | Stock Award(Grant) | Feb 16, 2026 | 59,507 |
| KORNSTEIN DONALD R | Director | Purchase | Mar 6, 2025 | 62,755 |
Institution ownership
| Holder | % held | Shares | Value | Reported |
|---|---|---|---|---|
| Blackrock Inc. | 13.49% | 27,501,706 | 799.20M | Jun 29, 2026 |
| Pentwater Capital Management Lp | 5.63% | 11,465,000 | 333.17M | Jun 29, 2026 |
| Vanguard Portfolio Management LLC | 5.06% | 10,304,031 | 299.44M | Jun 29, 2026 |
| Vanguard Capital Management LLC | 4.35% | 8,874,288 | 257.89M | Jun 29, 2026 |
| Morgan Stanley | 3.89% | 7,934,764 | 230.58M | Jun 29, 2026 |
| SG Americas Securities, LLC | 3.75% | 7,634,299 | 221.85M | Jun 29, 2026 |
Fund ownership
| Holder | % held | Shares | Value | Reported |
|---|---|---|---|---|
| iShares Trust-iShares Core S&P Small-Cap ETF | 5.95% | 12,134,519 | 352.63M | Sep 29, 2026 |
| VANGUARD INDEX FUNDS-Vanguard Total Stock Market Index Fund | 3.02% | 6,148,695 | 178.68M | Jun 29, 2026 |
| VANGUARD INDEX FUNDS-Vanguard Small-Cap Index Fund | 2.18% | 4,438,808 | 128.99M | Jun 29, 2026 |
| VANGUARD INDEX FUNDS-Vanguard Small-Cap Value Index Fund | 1.38% | 2,811,019 | 81.69M | Jun 29, 2026 |
| VANGUARD INDEX FUNDS-Vanguard Extended Market Index Fund | 1.15% | 2,336,391 | 67.90M | Jun 29, 2026 |
| BlackRock Large Cap Series Fd.s, Inc.-BlackRock Event Driven Eqy. Fd. | 0.98% | 1,992,037 | 57.89M | Aug 30, 2026 |