

Crescent Energy Company CRGY
10.75 USD -0.02 (-0.19%)
Regular-session close
10.75 0.00 0.00%
After hours · Nov 19, 4:56 PM ET
10.64 Day range 11.03
7.75 52-week range 15.37
- YTD
- +28.13%
- 1 year
- +19.31%
5D -0.77 (-6.67%)
- Market cap
- 5.22B
- Revenue (ttm)
- 4.79B
- Profit margin
- 1.29%
- EPS (ttm)
- 0.15
- Shares out
- 422.46M
- P/E ratio
- 71.67
- Forward P/E
- 3.39
- Dividend
- 0.48 (4.46%)
- Ex-dividend date
- Nov 16, 2026
- YTD return
- +28.13%
- 1-year return
- +19.31%
- Volume
- 5.21M
- Avg volume
- 7.91M
- Open
- 10.90
- Previous close
- 10.77
- Day's range
- 10.64 – 11.03
- 52-week range
- 7.75 – 15.37
- Beta
- 0.91
- Analysts
- Buy
- Price target
- 18.56 (+72.7%)
- Earnings date
- Feb 24, 2027
- 50-day average
- 13.07
Key statistics
- 200-day average
- 12.19
- Enterprise value
- 9.28B
- Price / sales
- 1.09
- Price / book
- 0.69
- Payout ratio
- 320.00%
- Revenue growth
- 55.90%
- Free cash flow
- 538.59M
- Total cash
- 6.13M
- Total debt
- 4.72B
- Return on equity
- 1.73%
- Short % of float
- 9.68%
Fundamental scorecard
15 of 25 checks passed on CRGY’s reported financials
15of 25 checks passed
- Value 2 of 5
- Growth 5 of 5
- Profitability 3 of 5
- Financial health 1 of 5
- Dividend 4 of 5
Statements to Sep 30, 2026.
Analyst view
Consensus: buy
Buy
Price target (mean) 18.56 +72.7% upside
Now 10.75
- Target (low)
- 12.00
- Target (mean)
- 18.56
- Target (high)
- 23.00
Ratings (0m) 17 14 buy · 3 hold · 0 sell
- Strong buy3
- Buy11
- Hold3
- Sell0
- Strong sell0
Next earnings
Feb 24, 2027
Expected Feb 24, 2027. Consensus EPS estimate 0.61936.
Financials — quick view
CRGY Revenue — quarterly 1.35B
CRGY Net income — quarterly -2.17M
CRGY EPS — quarterly -0.01
Earnings
| Report date | Quarter ending | EPS estimate | EPS reported | Surprise | Surprise % |
|---|---|---|---|---|---|
| Feb 24, 2027 | Dec 30, 2026 | 0.64 | — | — | — |
| Nov 2, 2026 | Sep 30, 2026 | 0.591 | 0.77 | +0.18 | +30.29% |
| Aug 3, 2026 | Jun 30, 2026 | 0.59 | 0.69 | +0.10 | +16.95% |
| May 4, 2026 | Mar 31, 2026 | 0.39 | 0.53 | +0.14 | +35.90% |
| Feb 25, 2026 | Dec 31, 2025 | 0.28 | 0.49 | +0.21 | +75.00% |
| Nov 3, 2025 | Sep 30, 2025 | 0.30 | 0.35 | +0.05 | +16.67% |
Upgrades / downgrades
| Date | Firm | Action | From | To |
|---|---|---|---|---|
| Nov 4, 2026 | Truist Securities | main | Buy | Buy |
| Oct 15, 2026 | Scotiabank | init | — | Sector Outperform |
| Oct 14, 2026 | Evercore ISI Group | main | Outperform | Outperform |
| Oct 13, 2026 | Wells Fargo | main | Overweight | Overweight |
| Oct 12, 2026 | UBS | main | Buy | Buy |
| Sep 17, 2026 | Truist Securities | init | — | Buy |
About Crescent Energy Company
Crescent Energy Company engages in the exploration and production of crude oil, natural gas, and natural gas liquids in the United States. The company's activities focused in Eagle Ford, Permian, and Uinta Basins. It owns minerals and royalty interests across the U.S. oil and natural gas basins. Crescent Energy Company was founded in 2011 and is headquartered in Houston, Texas.
- Sector
- Energy
- Industry
- Oil & Gas E&P
- Country
- United States
- Website
- crescentenergyco.com
News
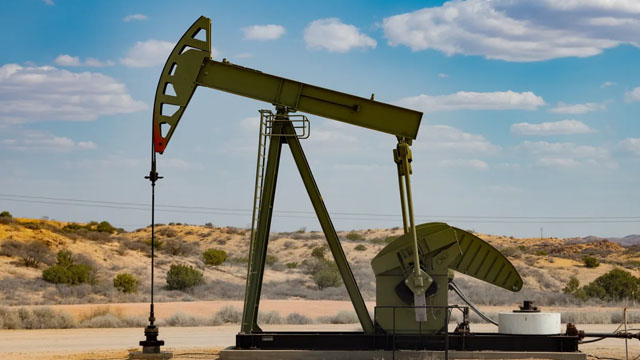 Crescent Energy: The Stock Should Begin To Perform Better
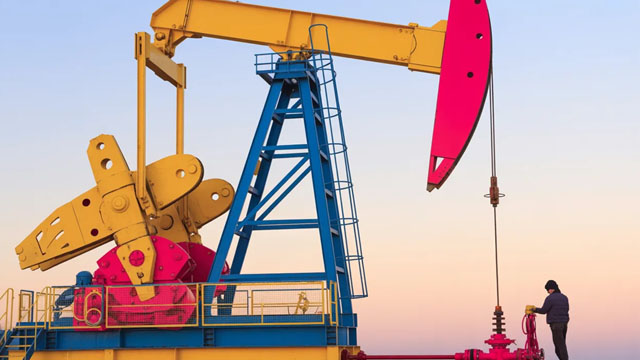 Crescent Energy: Devon's Deal Is Its Best Deal Yet
 Is Crescent Energy's Royalty Business Its Next Big Growth Engine?
 Are Oils-Energy Stocks Lagging Crescent Energy Company (CRGY) This Year?
 CRGY Stock After Q3 Earnings: Is More Upside on the Horizon?
 CRGY Q3 Earnings Beat on Higher Oil Prices and Production
 Truist Securities Maintains Buy on Crescent Energy, Raises Price Target to $20
 What Crescent Energy (CRGY) Said on Its Q3 Earnings Call
 Crescent Energy Company (CRGY) Q3 2026 Earnings Call Transcript
 Crescent Energy Q3 2026 Earnings Call Transcript
Your note
Sign in to keep a note on CRGY — it syncs with the Stock Master app.
Insider holders
| Insider | Relation | Latest transaction | Date | Shares held |
|---|---|---|---|---|
| ALBRECHT WILLIAM E. | Director | Stock Award(Grant) | Mar 31, 2026 | 82,075 |
| DUGINSKI MICHAEL | Director | Stock Award(Grant) | Mar 31, 2025 | 270,650 |
| GOFF JOHN C | Director | Stock Award(Grant) | Mar 31, 2026 | 9,836,800 |
| HALL JEROME D JR | Chief Operating Officer | Stock Award(Grant) | Sep 25, 2025 | 183,895 |
| INDEPENDENCE ENERGY AGGREGATOR L.P. | Beneficial Owner of more than 10% of a Class of Security | Conversion of Exercise of derivative security | Apr 3, 2025 | 0 |
| KKR GROUP PARTNERSHIP, L.P. | Beneficial Owner of more than 10% of a Class of Security | Conversion of Exercise of derivative security | Apr 3, 2025 | 0 |
Institution ownership
| Holder | % held | Shares | Value | Reported |
|---|---|---|---|---|
| Blackrock Inc. | 10.65% | 45,011,216 | 483.42M | Sep 29, 2026 |
| Kohlberg Kravis Roberts & Co. L.P. | 6.78% | 28,655,357 | 307.76M | Sep 29, 2026 |
| American Century Companies Inc | 4.36% | 18,431,613 | 197.96M | Sep 29, 2026 |
| State Street Corporation | 4.36% | 18,423,220 | 197.87M | Sep 29, 2026 |
| Dimensional Fund Advisors LP | 4.33% | 18,311,297 | 196.66M | Sep 29, 2026 |
| Vanguard Portfolio Management LLC | 4.15% | 17,512,943 | 188.09M | Sep 29, 2026 |
Fund ownership
| Holder | % held | Shares | Value | Reported |
|---|---|---|---|---|
| iShares Trust-iShares Core S&P Small-Cap ETF | 4.19% | 17,709,052 | 190.20M | Sep 29, 2026 |
| American Century ETF Trust-Avantis U.S. Small Cap Value ETF | 2.50% | 10,567,209 | 113.49M | Sep 29, 2026 |
| VANGUARD INDEX FUNDS-Vanguard Total Stock Market Index Fund | 2.11% | 8,917,639 | 95.78M | Jun 29, 2026 |
| iShares Trust-iShares Russell 2000 ETF | 1.79% | 7,556,756 | 81.16M | Sep 29, 2026 |
| SPDR SERIES TRT-State Street SPDR S&P Oil & Gas Exploration & Producti | 1.77% | 7,488,130 | 80.42M | Sep 29, 2026 |
| VANGUARD INDEX FUNDS-Vanguard Small-Cap Index Fund | 1.53% | 6,444,820 | 69.22M | Jun 29, 2026 |