

Costco Wholesale Corporation COST
At closeNov 3, 2026, 5:33 PM EST
After hours · Nov 3, 5:33 PM ET
- YTD
- +18.20%
- 1 year
- +9.83%
- Market cap
- 451.66B
- Revenue (ttm)
- 303.15B
- Profit margin
- 3.04%
- EPS (ttm)
- 20.76
- Shares out
- 443.13M
- P/E ratio
- 49.10
- Forward P/E
- 40.73
- Dividend
- 5.88 (0.57%)
- Ex-dividend date
- Oct 29, 2026
- YTD return
- +18.20%
- 1-year return
- +9.83%
- Volume
- 1.91M
- Avg volume
- 2.11M
- Open
- 1,031.18
- Previous close
- 1,040.55
- Day's range
- 1,019.08 – 1,034.77
- 52-week range
- 844.06 – 1,096.50
- Beta
- 0.85
- Analysts
- Buy
- Price target
- 1,067.59 (+4.7%)
- Earnings date
- Dec 10, 2026
30m +36.80 (+3.75%)
Key statistics
- Enterprise value
- 449.98B
- PEG ratio
- 5.21
- Price / sales
- 1.49
- Price / book
- 12.62
- Dividend yield
- 0.57%
- Payout ratio
- 26.69%
- Revenue growth
- 11.10%
- Free cash flow
- 6.75B
- Total cash
- 21.30B
- Total debt
- 10.18B
- Return on equity
- 28.40%
- Short % of float
- 1.72%
- 50-day average
- 945.16
- 200-day average
- 971.33
Analyst view
Consensus: buy
- Target (low)
- 770.00
- Target (mean)
- 1,067.59
- Target (high)
- 1,315.00
- Strong buy5
- Buy21
- Hold13
- Sell1
- Strong sell1
Next earnings
Dec 10, 2026
Expected Dec 10, 2026. Consensus EPS estimate 4.94.
Financials — quick view
Earnings
| Report date | Quarter ending | EPS estimate | EPS reported | Surprise | Surprise % |
|---|---|---|---|---|---|
| Dec 10, 2026 | Nov 30, 2026 | 4.93 | — | — | — |
| Sep 24, 2026 | Aug 30, 2026 | 6.54 | 6.75 | +0.21 | +3.21% |
| May 28, 2026 | May 10, 2026 | 5.00 | 4.93 | -0.07 | -1.40% |
| Mar 5, 2026 | Feb 15, 2026 | 4.55 | 4.58 | +0.03 | +0.66% |
| Dec 11, 2025 | Nov 23, 2025 | 4.27 | 4.50 | +0.23 | +5.39% |
| Sep 25, 2025 | Aug 31, 2025 | 5.80 | 5.87 | +0.07 | +1.21% |
Upgrades / downgrades
| Date | Firm | Action | From | To |
|---|---|---|---|---|
| Oct 21, 2026 | CICC | init | — | Outperform |
| Oct 15, 2026 | Tigress Financial | main | Buy | Buy |
| Oct 9, 2026 | RBC Capital | reit | Sector Perform | Sector Perform |
| Sep 28, 2026 | Deutsche Bank | main | Buy | Buy |
| Sep 28, 2026 | Argus Research | reit | Buy | Buy |
| Sep 25, 2026 | Freedom Broker | main | Buy | Buy |
About Costco Wholesale Corporation
Costco Wholesale Corporation, together with its subsidiaries, engages in the operation of membership warehouses in the United States, Puerto Rico, Canada, Mexico, Japan, the United Kingdom, Korea, Australia, Taiwan, China, Spain, France, Sweden, Iceland, and New Zealand. It offers merchandise, including sundries, dry groceries, candies, coolers, freezers, liquor, and tobacco; non-food merchandise comprising consumer electronics, appliances, small electrics, health and beauty aids, hardware, lawn and garden, sporting goods, tires, toys and seasonal, automotive, stamps, tickets, apparel, furniture, domestics, housewares, special order kiosks, and jewelry; and fresh food, such as meat, produce, deli, and bakery products. The company is also involved in warehouse ancillary operations, which include gasoline, pharmacies, food courts, optical, hearing aids, and tire installation centers. In addition, it engages in e-commerce, business centers, travel, and other businesses. Further, the company operates e-commerce sites; and offers branded and private-label products in various categories. The company was formerly known as Costco Companies, Inc. and changed its name to Costco Wholesale Corporation in August 1999. Costco Wholesale Corporation was founded in 1976 and is based in Issaquah, Washington.
- Sector
- Consumer Defensive
- Industry
- Discount Stores
- Country
- United States
- Website
- costco.com
News
 The Best Blue Chip Stock to Buy in November and Hold for 10 Years
 Growth And Cyclical Lead Sectors Tuesday
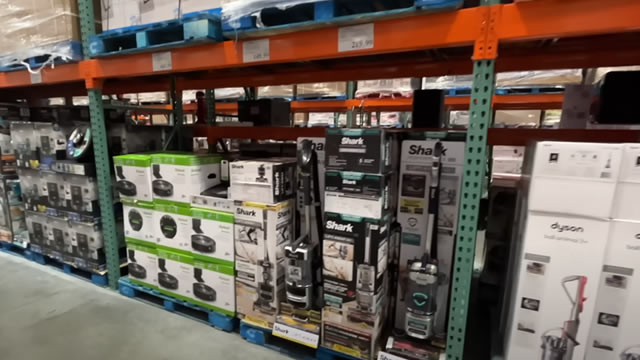 Costco Hasn't Split Its Stock Since 2000. Here's Why 2027 Could Be the Year.
 BOCHK Asset Management Ltd Acquires 1,350 Shares of Costco Wholesale Corporation $COST
 Costco Wholesale Stock Is Trading Over $1,000. Here's Why a Stock Split Still May Not Come in 2027.
 The Big 3: INTC, COST, OKTA
 Can Costco's DoorDash and Uber Eats Expansion Drive Incremental Sales?
 Here is What to Know Beyond Why Costco Wholesale Corporation (COST) is a Trending Stock
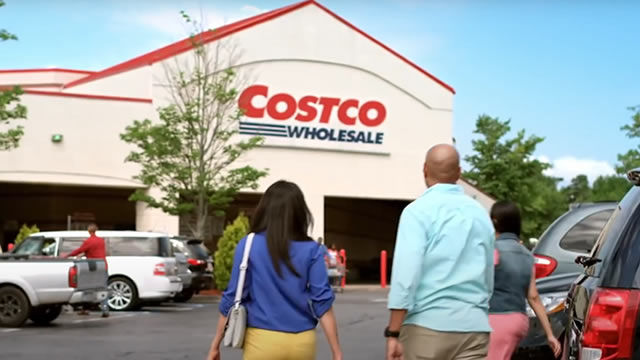 Costco to pay dividends next week; Here's how much 100 COST shares will earn
 The latest update on the grocery wars is here, with Walmart and Costco gaining ground
Your note
Sign in to keep a note on COST — it syncs with the Stock Master app.
Insider holders
| Insider | Relation | Latest transaction | Date | Shares held |
|---|---|---|---|---|
| CALLANS PATRICK J | Officer | Stock Award(Grant) | Sep 9, 2025 | 61,811 |
| JAMES HAMILTON E | Director | Stock Award(Grant) | Oct 21, 2026 | 56,954 |
| JELINEK WALTER CRAIG | Director | Stock Gift | Dec 18, 2024 | 354,392 |
| KLAUER JAMES C | Officer | Stock Award(Grant) | Sep 9, 2026 | 48,128 |
| MILLERCHIP GARY | Officer | Stock Award(Grant) | Oct 21, 2026 | 19,974 |
| RIEL PIERRE | Officer | Stock Award(Grant) | Sep 9, 2026 | 14,246 |
Institution ownership
| Holder | % held | Shares | Value | Reported |
|---|---|---|---|---|
| Blackrock Inc. | 7.72% | 34,202,834 | 34.86B | Jun 29, 2026 |
| Vanguard Capital Management LLC | 6.54% | 28,976,605 | 29.53B | Jun 29, 2026 |
| State Street Corporation | 4.15% | 18,384,951 | 18.74B | Jun 29, 2026 |
| Invesco Ltd. | 3.16% | 13,989,137 | 14.26B | Jun 29, 2026 |
| Geode Capital Management, LLC | 2.40% | 10,627,472 | 10.83B | Jun 29, 2026 |
| Vanguard Portfolio Management LLC | 2.35% | 10,402,555 | 10.60B | Jun 29, 2026 |
Fund ownership
| Holder | % held | Shares | Value | Reported |
|---|---|---|---|---|
| VANGUARD INDEX FUNDS-Vanguard Total Stock Market Index Fund | 3.18% | 14,083,929 | 14.36B | Jun 29, 2026 |
| VANGUARD INDEX FUNDS-Vanguard 500 Index Fund | 2.59% | 11,495,159 | 11.72B | Jun 29, 2026 |
| Invesco QQQ Trust, Series 1 | 2.09% | 9,263,258 | 9.44B | Sep 29, 2026 |
| iShares Trust-iShares Core S&P 500 ETF | 1.33% | 5,909,193 | 6.02B | Sep 29, 2026 |
| Fidelity Concord Street Trust-Fidelity 500 Index Fund | 1.30% | 5,759,016 | 5.87B | Aug 30, 2026 |
| SPDR S&P 500 ETF TRUST-State Street SPDR S&P 500 ETF Trust | 1.24% | 5,484,928 | 5.59B | Sep 29, 2026 |